


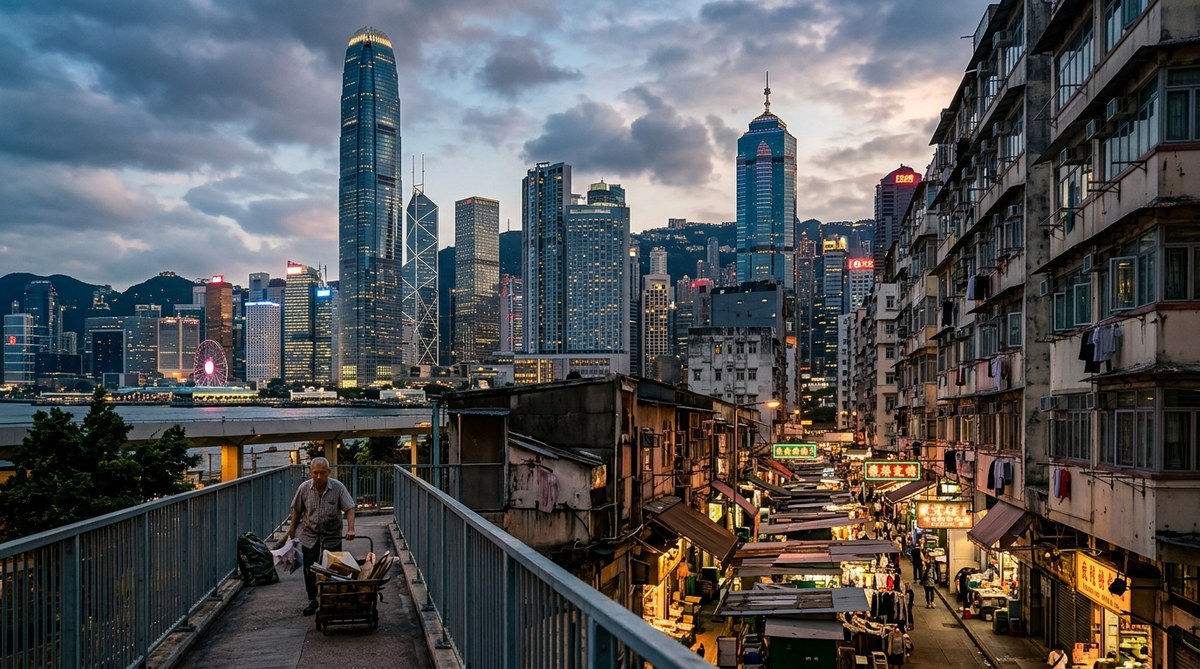
How Hong Kong’s Dual Economy Is Creating a New Underclass in 2026
Hong Kong has always been a city of extremes. You can stand on a bustling…
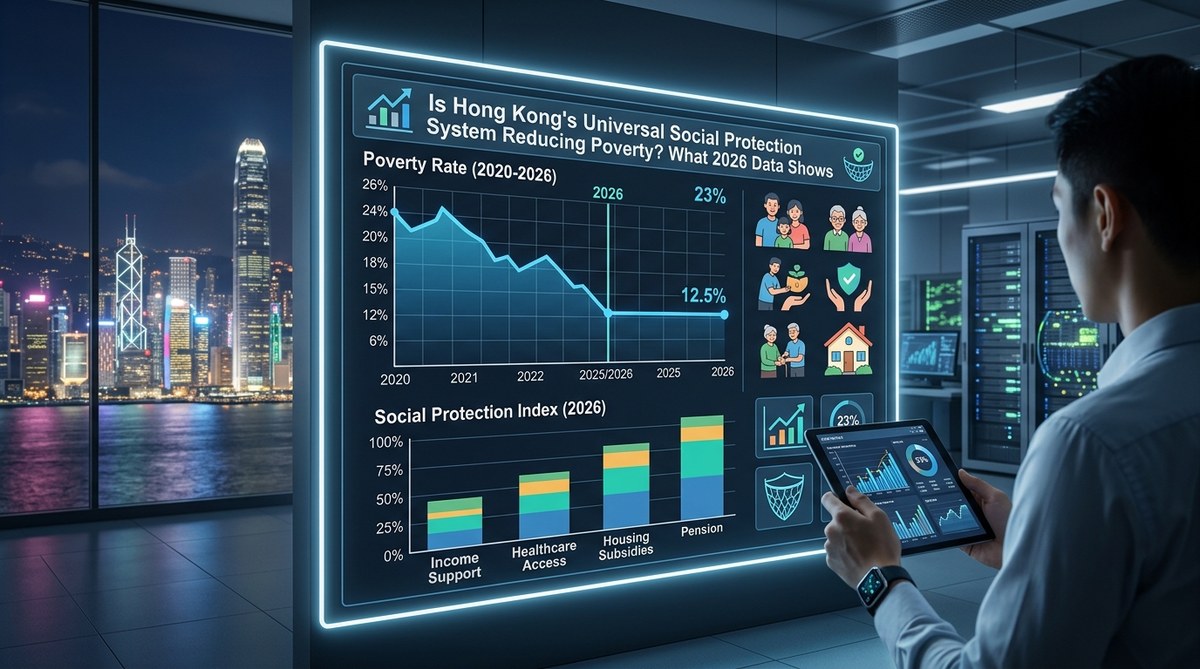
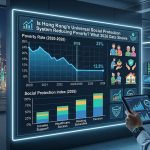
Is Hong Kong’s Universal Social Protection System Reducing Poverty? What 2026 Data Shows
Hong Kong's universal social protection system was designed to catch those who fall through the…
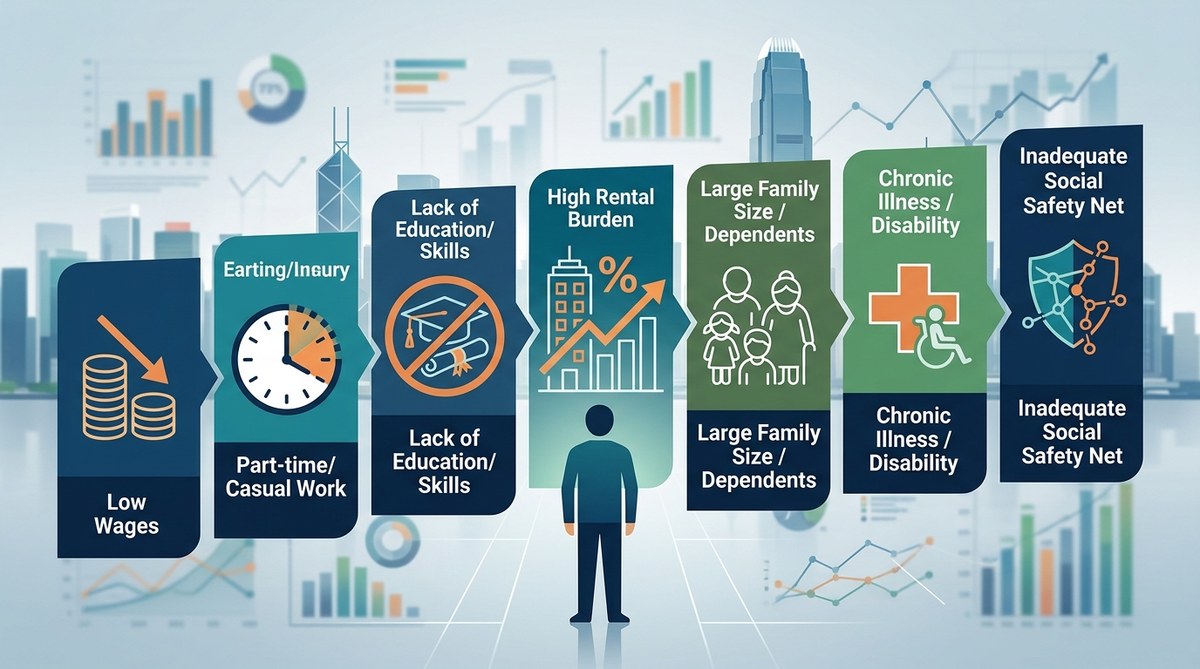
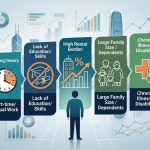
7 Key Indicators That Predict Which Hong Kong Workers Will Fall Into Poverty Next Year
Think about your last pay slip. Did it stretch far enough? For many workers in…
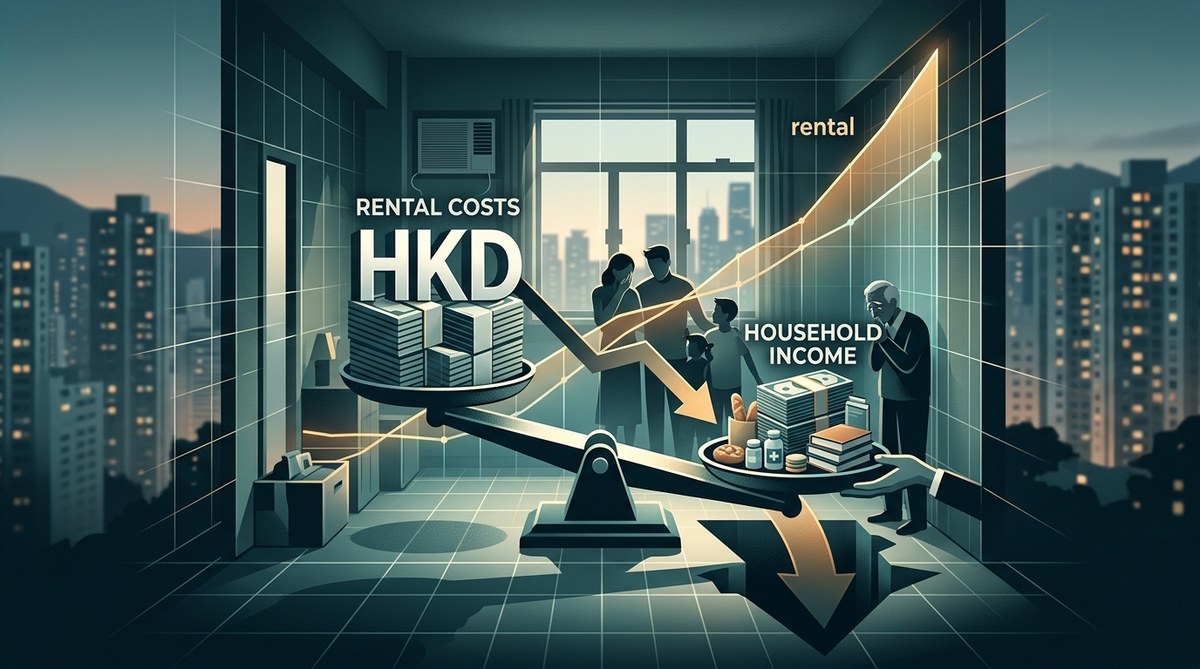
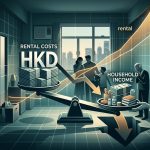
How Hong Kong’s Rental Market Is Pushing Low-Income Families Deeper Into Poverty in 2026
Hong Kong’s rental market has reached a tipping point. In 2026, low-income families are spending…
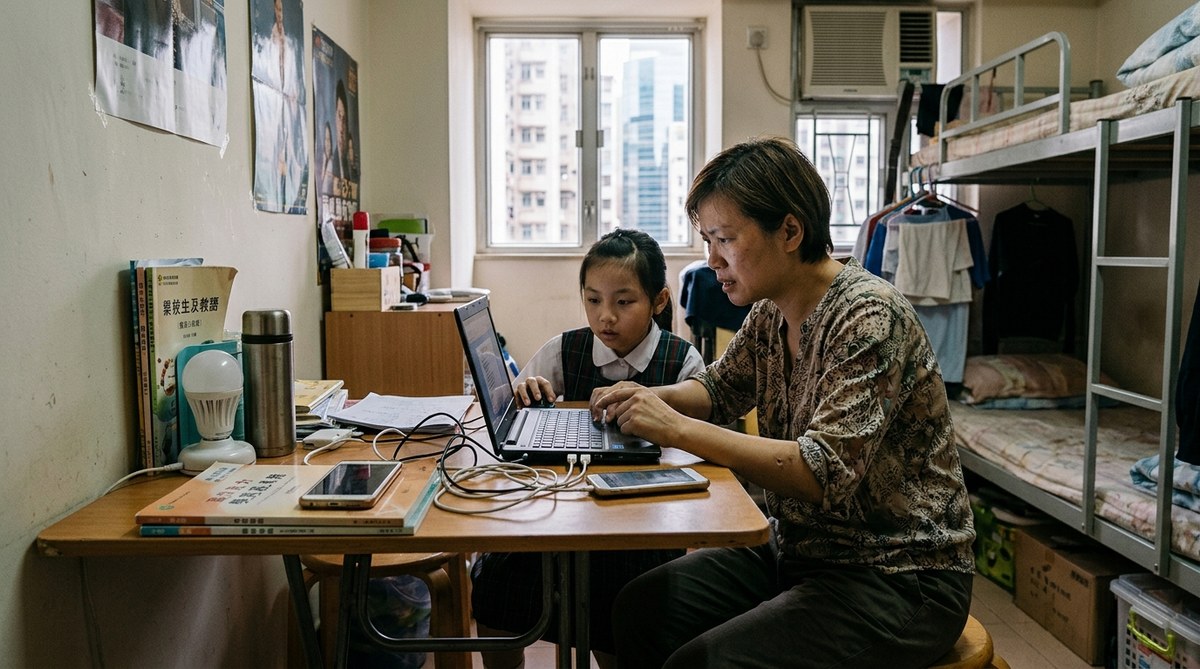
Are Hong Kong’s Low-Income Families Being Excluded from the Digital Economy? 2026 Data
Imagine a family in Kwun Tong. The parents work in a restaurant and a cleaning…
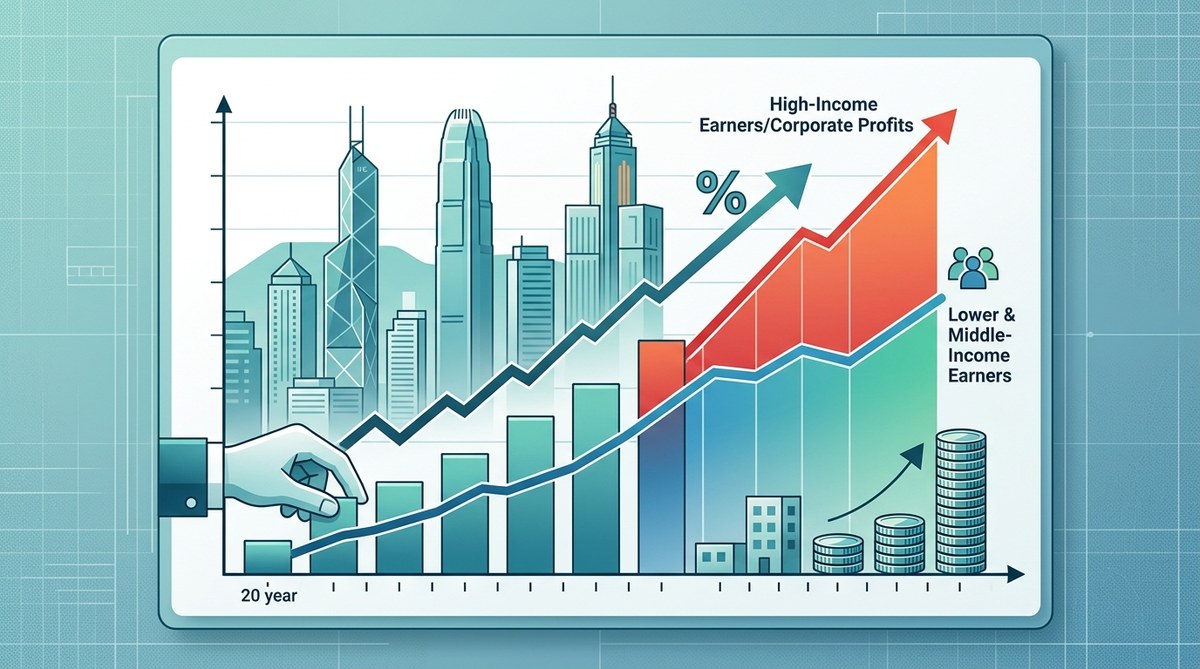
How Hong Kong’s Tax System Exacerbates Income Inequality: 20 Years of Data
Hong Kong has a reputation for low taxes. That is true for most people. But…
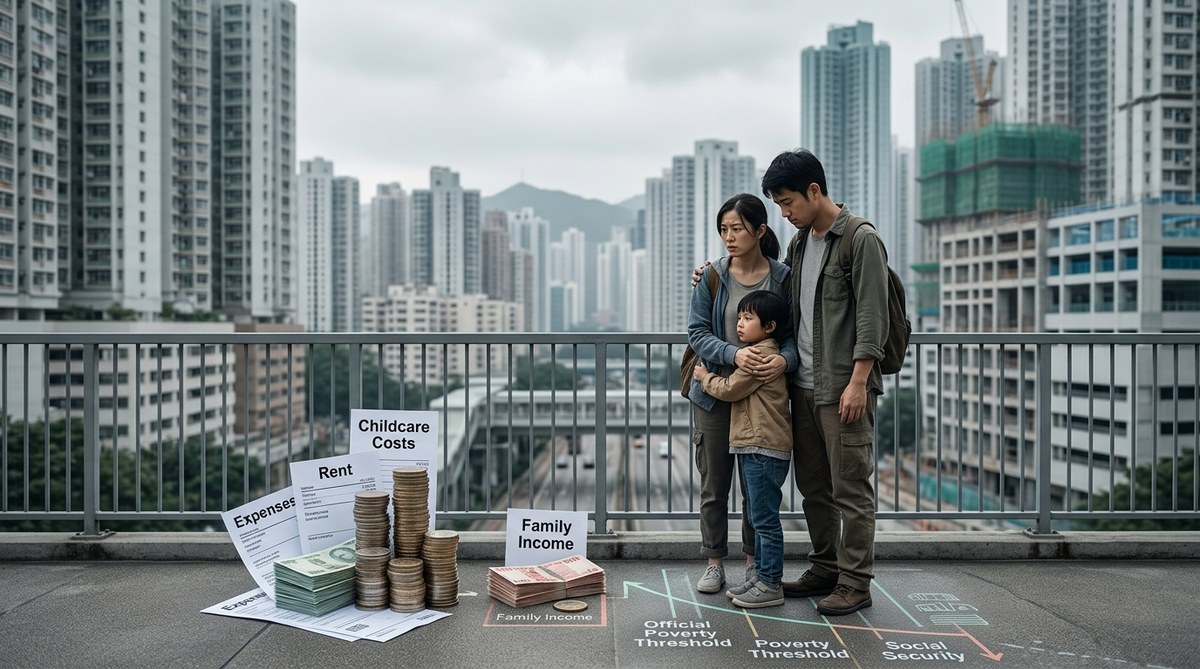
Why Hong Kong’s Childcare Costs Are Pushing Families Below the Poverty Line in 2026
If you live in Hong Kong and have a young child, you already know the…

How Part-Time Employment Is Driving Poverty Rates Among Hong Kong’s Working Age Population
The evening rush on the MTR carries thousands of workers home, but for a growing…
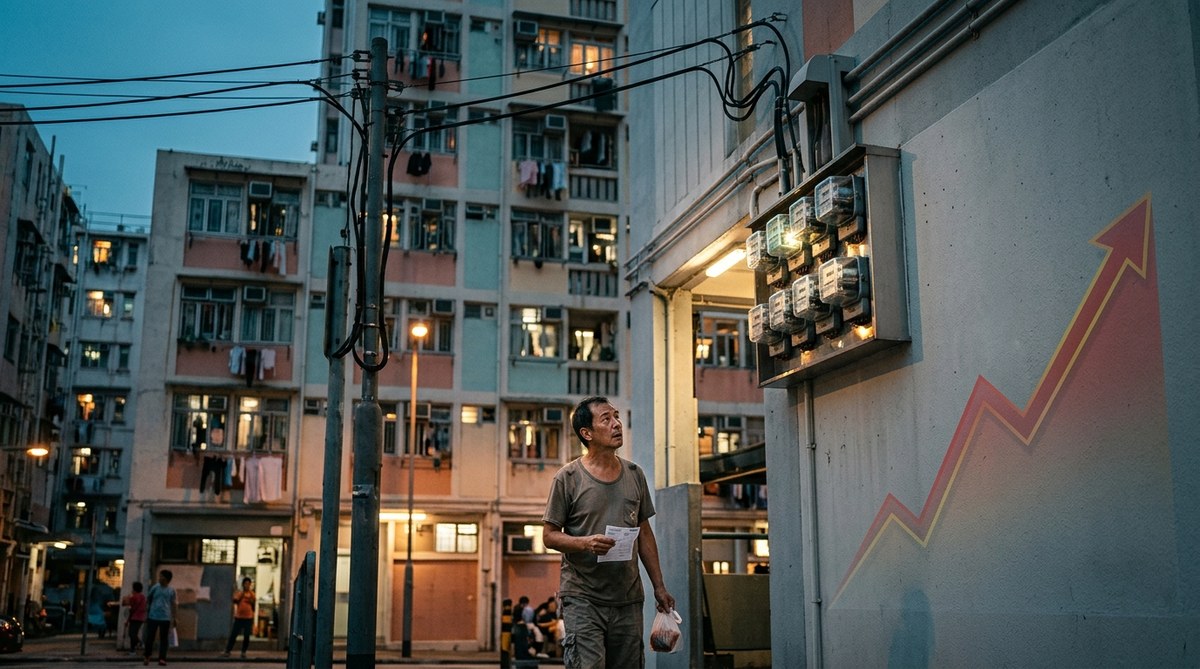
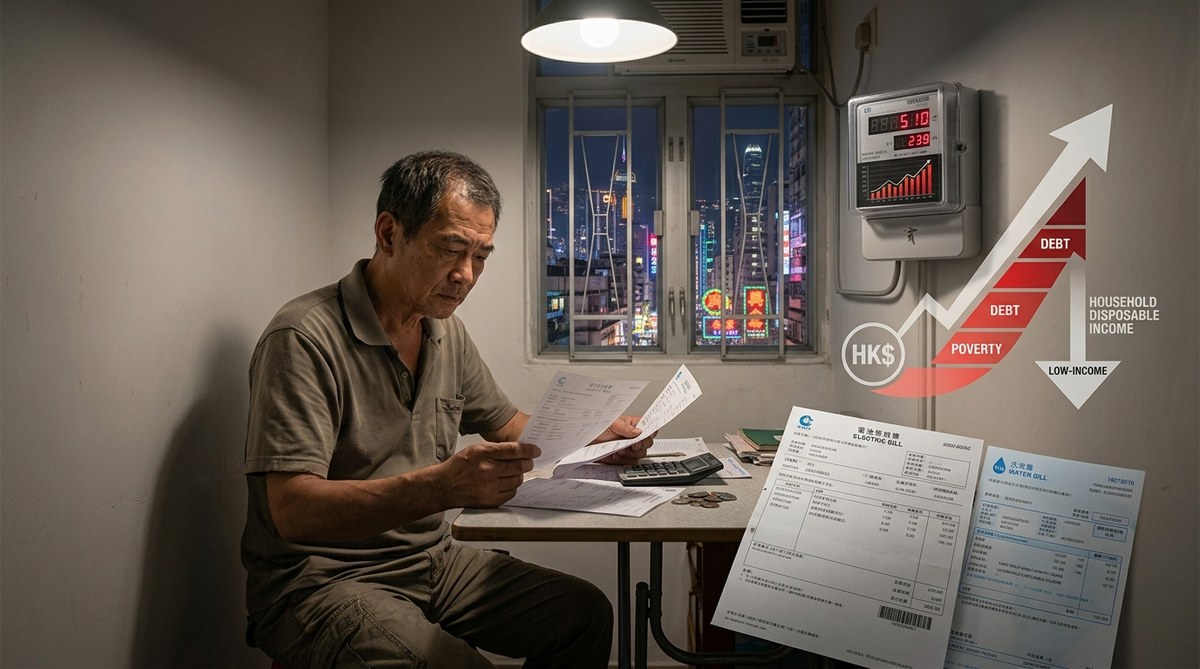
How Rising Utility Costs Fuel a Hidden Poverty Crisis in Hong Kong
Most people in Hong Kong think of poverty in terms of low wages or unaffordable…