


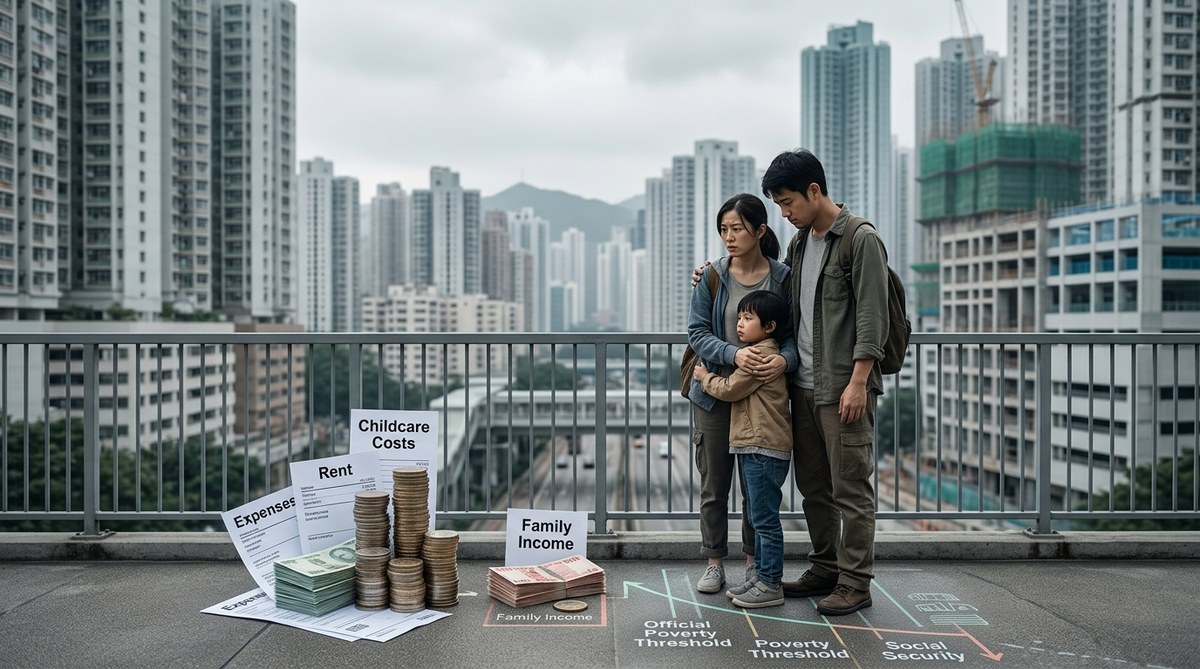
Why Hong Kong’s Childcare Costs Are Pushing Families Below the Poverty Line in 2026
If you live in Hong Kong and have a young child, you already know the…

How Part-Time Employment Is Driving Poverty Rates Among Hong Kong’s Working Age Population
The evening rush on the MTR carries thousands of workers home, but for a growing…
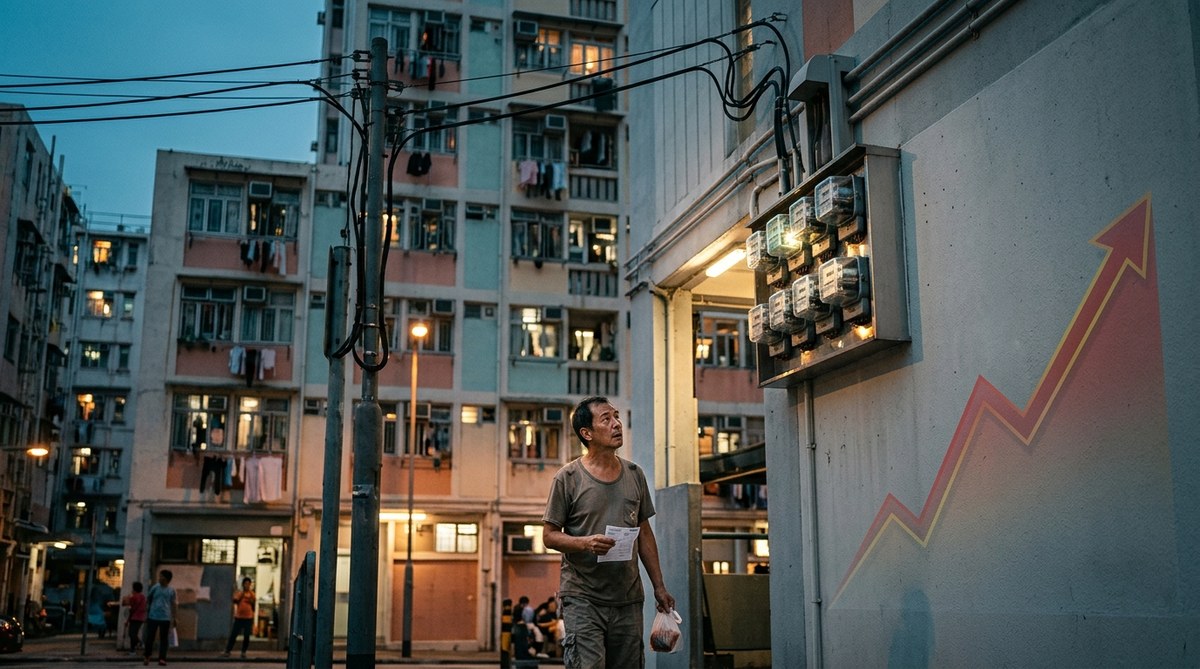
How Rising Utility Costs Fuel a Hidden Poverty Crisis in Hong Kong
Most people in Hong Kong think of poverty in terms of low wages or unaffordable…
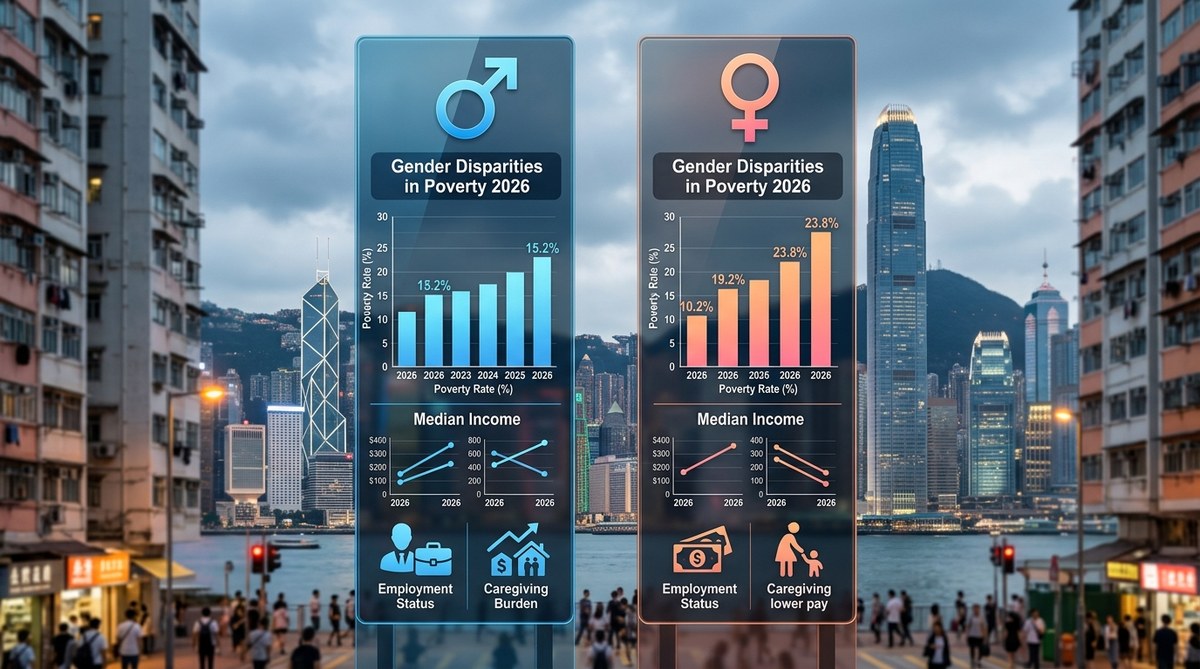
Is There a Gender Dimension to Hong Kong’s Poverty Crisis? 2026 Data Reveals Disparities
In 2026, Hong Kong’s poverty statistics tell a story that goes beyond income thresholds. The…

Can Hong Kong’s Tech Boom Reduce Poverty? What 2026 Employment Data Shows
Hong Kong is in the middle of a serious tech boom. The government is pouring…

Two Decades of Data Show How Rising Food Costs Are Driving Poverty in Hong Kong
When you walk into a supermarket in Hong Kong, a single head of lettuce can…
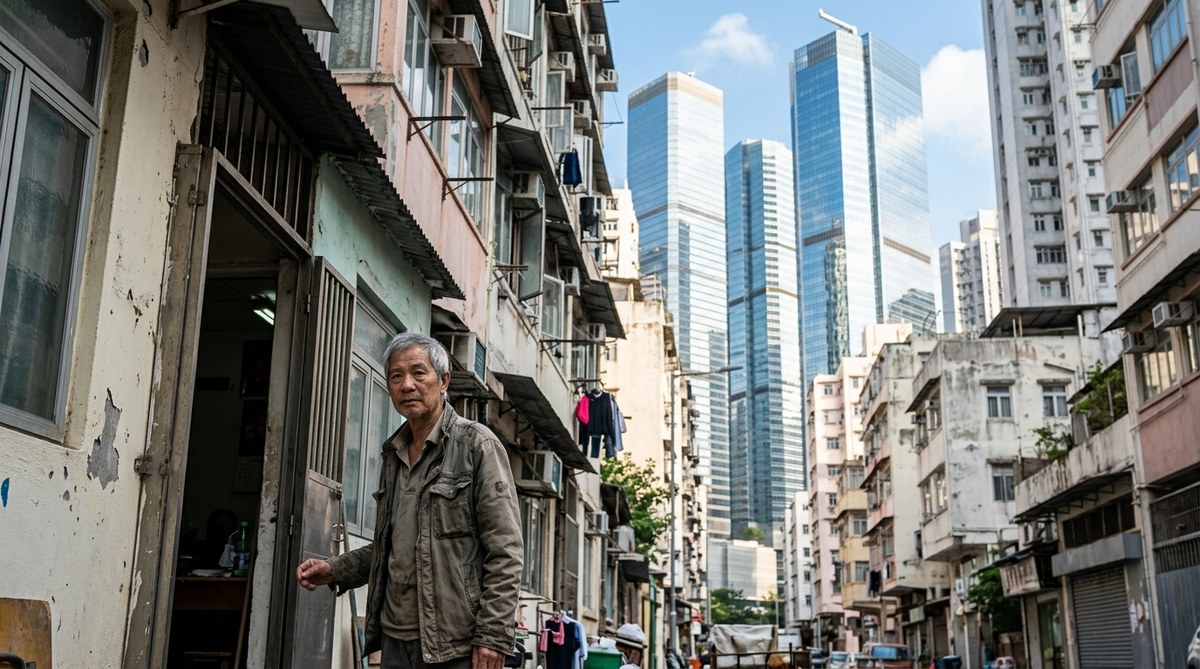
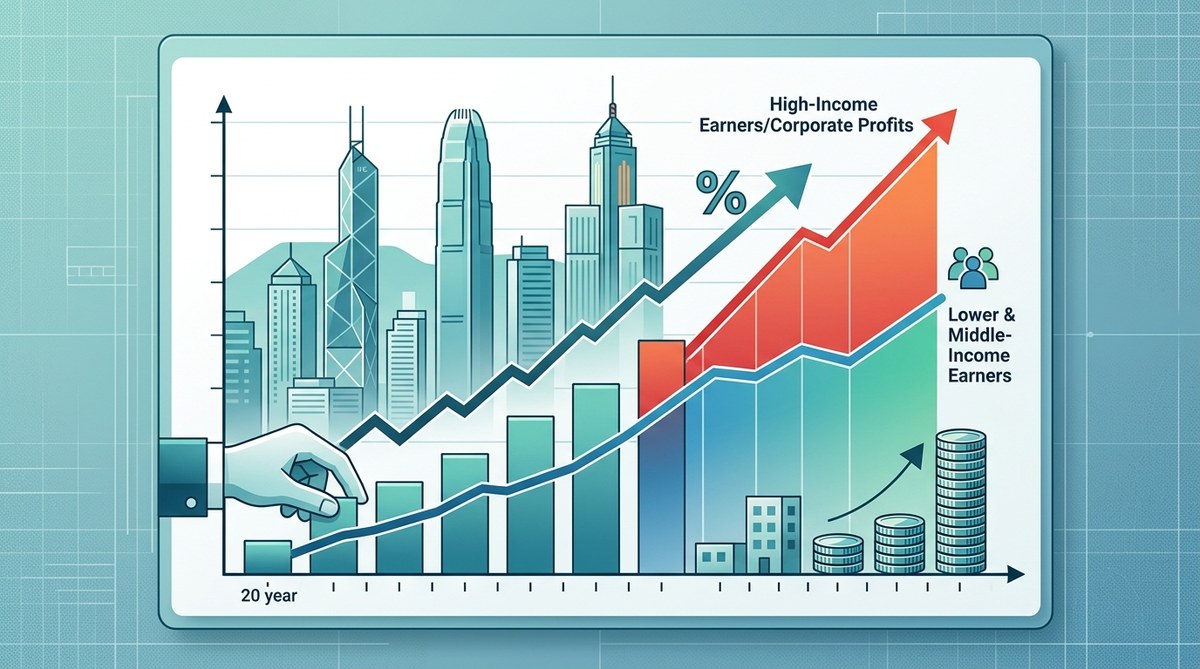
Is Hong Kong’s Economic Growth Failing Its Poorest Residents? 2026 Statistics Answer
Hong Kong's skyline tells a story of immense wealth. Glittering towers, luxury boutiques, and a…

5 Key Economic Reforms That Could Reduce Poverty in Hong Kong by 2030
Hong Kong is one of the world's wealthiest cities, yet nearly one in five residents…
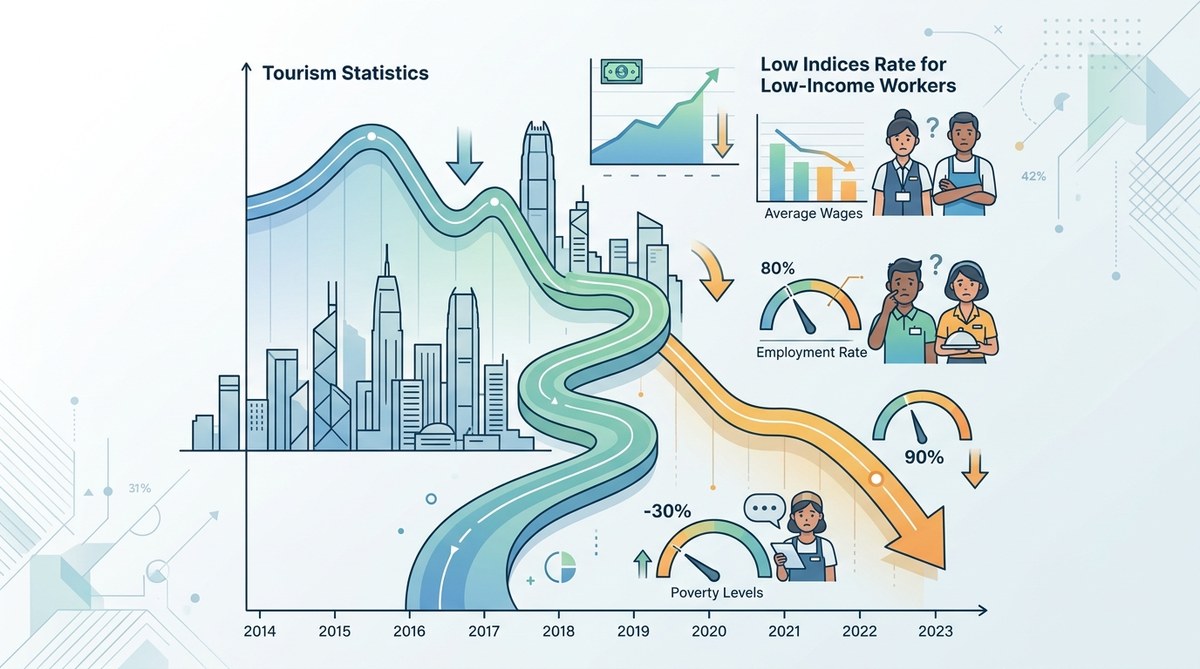
How Hong Kong’s Tourism Downturn Has Affected Low-Income Workers: A Decade of Data
Between 2019 and 2021, Hong Kong lost more than 90% of its international visitor arrivals.…