Blog

  • Youth Unemployment and Underemployment: Statistical Trends Shaping a Generation

    Youth Unemployment and Underemployment: Statistical Trends Shaping a Generation

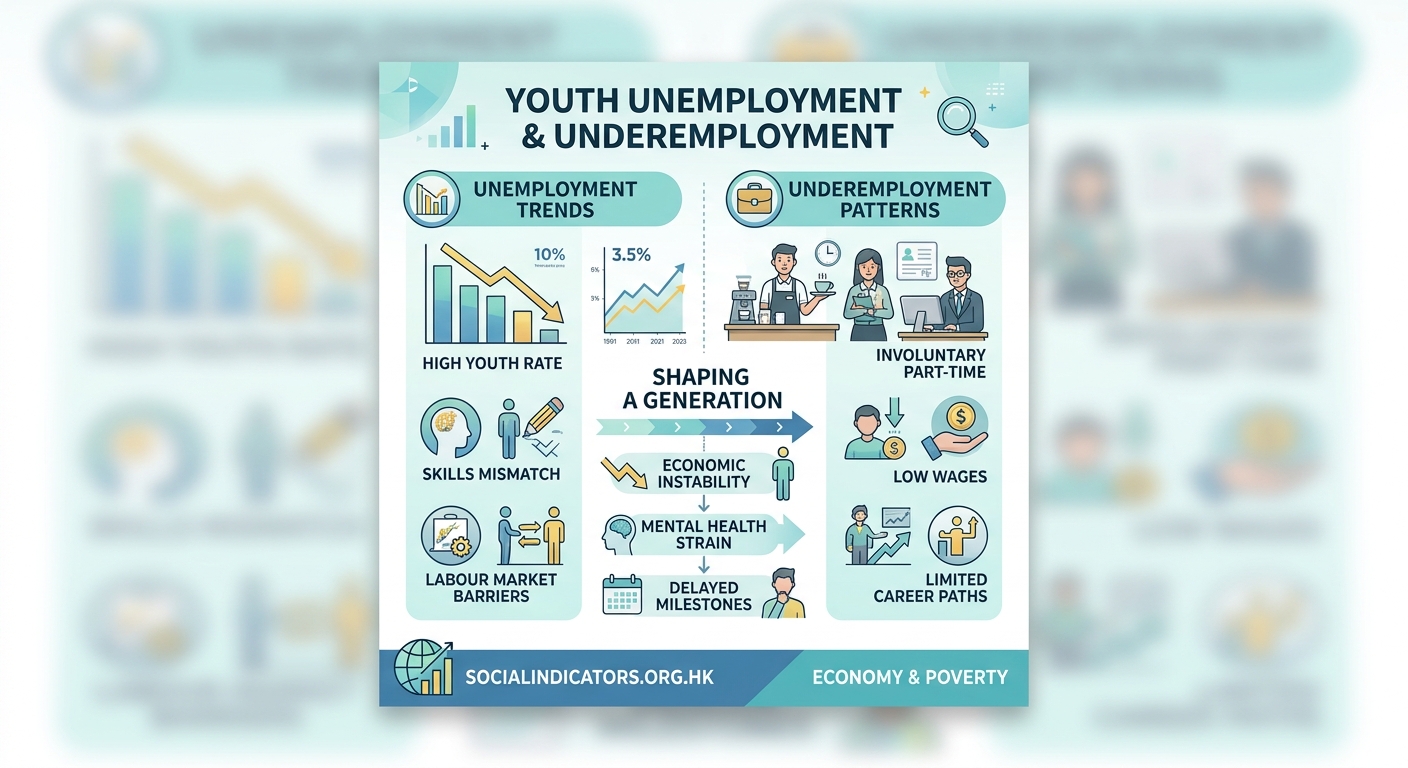
    The job market for young people in Hong Kong tells a story that numbers can’t hide. When a 22-year-old graduate sends out dozens of applications without hearing back, or when a talented 19-year-old works part-time despite wanting full-time employment, these experiences show up in the data. Youth unemployment statistics reveal patterns that shape policy decisions, inform educational strategies, and help us understand what an entire generation faces.

    Key Takeaway

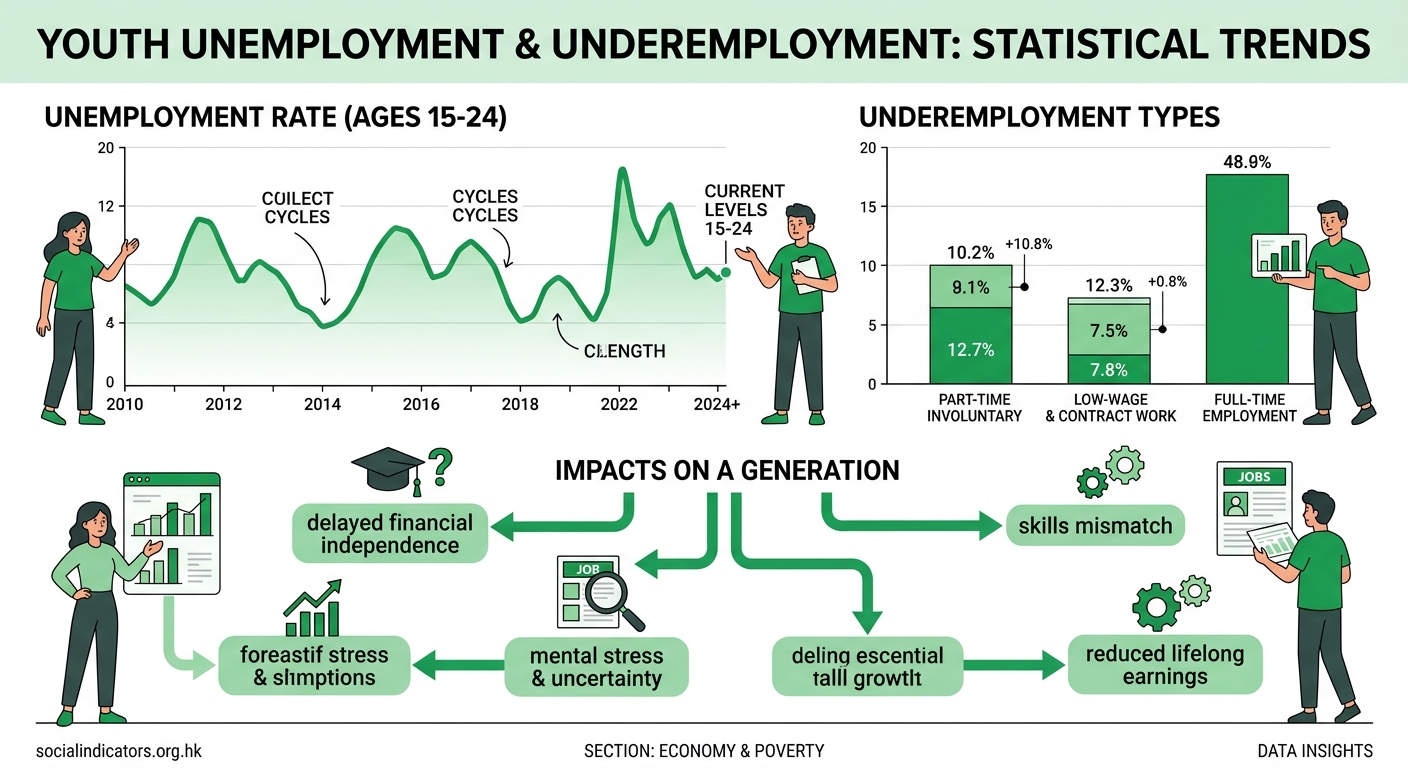
    Youth unemployment statistics in Hong Kong track labor market participation for individuals aged 15-24, measuring both those actively seeking work and those underemployed. These figures inform policy development, reveal economic trends, and help researchers understand structural barriers young people face. Current data shows youth unemployment rates consistently exceed overall population rates, with seasonal fluctuations tied to graduation cycles and economic conditions affecting entry-level positions most severely.

    Understanding the core measurements

    Youth unemployment statistics focus on a specific age bracket: 15 to 24 years old. This group represents people transitioning from education to work, seeking their first jobs, or establishing early career paths.

    The unemployment rate calculates the percentage of young people in the labor force who are jobless but actively seeking employment. Someone counts as unemployed only if they’re available for work and have taken concrete steps to find a job within a reference period.

    Underemployment adds another layer. A person working part-time who wants full-time hours shows up in underemployment figures. So does someone with skills far beyond their current role. These statistics matter because they capture economic waste and personal frustration that pure unemployment numbers miss.

    Hong Kong’s Census and Statistics Department releases these figures quarterly. They use household surveys that reach thousands of residents, creating a representative sample of the population.

    Breaking down the demographic patterns

    Youth Unemployment and Underemployment: Statistical Trends Shaping a Generation - Illustration 1

    Age matters enormously in youth labor statistics. A 15-year-old faces different challenges than a 23-year-old. The younger cohort often juggles school with part-time work. The older group typically seeks career-starting positions.

    Educational attainment creates distinct pathways. University graduates enter the job market with different expectations and opportunities than those with secondary education. Vocational training opens specific doors that academic credentials don’t.

    Gender differences appear in the data too. Women and men sometimes concentrate in different industries, face different hiring biases, and experience varying unemployment durations.

    Here’s how researchers typically segment youth unemployment data:

    • Age brackets (15-19 and 20-24)
    • Educational level (secondary, post-secondary, university)
    • Industry sector preferences
    • Duration of unemployment (short-term vs. long-term)
    • First-time job seekers vs. those with work history
    • Full-time vs. part-time work seekers

    Seasonal and cyclical factors

    Youth unemployment doesn’t stay constant throughout the year. Graduation season brings waves of new job seekers. Summer months see students seeking temporary work. Economic downturns hit young workers harder than experienced employees.

    The data shows predictable spikes. May through August typically sees higher youth unemployment as graduates enter the market. Retail and hospitality sectors hire more young workers during holiday seasons, creating temporary dips.

    Economic recessions amplify these patterns. Companies freeze hiring or cut entry-level positions first. Young people lack the experience and networks that help older workers weather storms.

    Youth unemployment rates serve as an early warning system for broader economic troubles. When young people can’t find work, it signals structural problems that will affect everyone eventually.

    Comparing Hong Kong to regional benchmarks

    Youth Unemployment and Underemployment: Statistical Trends Shaping a Generation - Illustration 2

    Context matters when interpreting youth unemployment statistics. A 6% rate might seem low compared to some European countries but high relative to Singapore or Japan.

    Regional comparisons reveal policy effectiveness. Countries with strong apprenticeship programs often show lower youth unemployment. Places with rigid labor markets might see higher rates but shorter unemployment durations.

    Region Typical Youth Rate Overall Rate Key Factors
    Hong Kong 8-12% 3-4% Service economy, education mismatch
    Singapore 6-9% 2-3% Strong vocational training, government programs
    Japan 4-6% 2-3% Structured hiring seasons, company loyalty
    South Korea 9-11% 3-4% Competitive job market, high education levels
    Taiwan 8-10% 3-4% Manufacturing decline, service growth

    Data collection methodology

    Understanding how statisticians gather youth unemployment data helps researchers evaluate its reliability and limitations.

    The process follows these steps:

    1. Random household selection across geographic areas to ensure representative sampling
    2. Trained interviewers conduct face-to-face or phone surveys using standardized questionnaires
    3. Respondents answer questions about work status, job search activities, and availability
    4. Data undergoes quality checks and statistical adjustments for non-response and seasonal patterns
    5. Final figures receive seasonal adjustment to reveal underlying trends separate from predictable fluctuations

    Sample sizes matter. Larger samples provide more reliable estimates but cost more. Hong Kong’s surveys typically include tens of thousands of households, creating confidence intervals narrow enough for policy work.

    Underemployment adds crucial context

    Someone working 15 hours per week who wants 40 hours faces real economic hardship. Traditional unemployment statistics miss this entirely. Underemployment rates capture these situations.

    Time-related underemployment measures people working fewer hours than they want. Skill-related underemployment tracks those in jobs below their qualification level. Both types waste human potential and signal labor market dysfunction.

    Young workers experience underemployment at higher rates than older groups. Fresh graduates often accept positions unrelated to their studies. Part-time workers struggle to find full-time opportunities. Contract and gig work replace stable employment.

    The gap between unemployment and underemployment reveals market quality. A low unemployment rate with high underemployment suggests jobs exist but they’re inadequate. This pattern appears frequently in service-heavy economies.

    Long-term unemployment among youth

    Duration matters as much as incidence. Someone unemployed for two months faces different challenges than someone jobless for a year. Long-term unemployment (typically defined as six months or more) causes skill erosion, psychological stress, and reduced lifetime earnings.

    Young people who experience extended unemployment early in their careers often earn less for decades. Employers view employment gaps suspiciously. Networks atrophy without workplace connections. Confidence erodes with each rejection.

    Statistics tracking unemployment duration help identify who needs intensive support. Short spells might reflect normal job search friction. Extended periods signal serious barriers requiring intervention.

    Industry-specific patterns

    Youth unemployment concentrates in particular sectors. Entry-level positions in finance, technology, and professional services attract many applicants per opening. Retail, food service, and hospitality hire more young workers but offer less stability.

    Manufacturing decline hits young workers especially hard. These jobs historically provided pathways for those without university education. As factories close or automate, alternative routes into middle-class employment narrow.

    The rise of platform work and gig economy jobs complicates measurement. Someone driving for a ride-sharing service or doing freelance tasks might not appear in traditional employment statistics despite earning income. These arrangements often lack benefits, stability, and advancement opportunities.

    Policy implications from the data

    Governments use youth unemployment statistics to design interventions. High rates might trigger:

    • Wage subsidies encouraging employers to hire young workers
    • Training programs addressing skill mismatches
    • Job search assistance and career counseling
    • Support for entrepreneurship and self-employment
    • Public sector hiring initiatives
    • Education reforms aligning curricula with market needs

    Evaluating these programs requires good baseline data. If youth unemployment was 10% before an intervention and 8% after, did the program work or did the economy improve independently? Researchers need detailed statistics to answer such questions.

    Common measurement challenges

    No statistical system captures reality perfectly. Youth unemployment data faces several limitations that researchers must acknowledge.

    Definition debates persist. Should full-time students seeking part-time work count as part of the labor force? What about someone who stopped searching after months of rejection? These boundary cases affect final numbers.

    Survey timing creates artifacts. Conducting interviews right after graduation produces different results than surveys in mid-year. Seasonal adjustment tries to correct this but introduces its own assumptions.

    Informal work escapes official measurement. Young people doing odd jobs, helping family businesses without pay, or working in gray-market activities won’t appear in standard statistics. This matters more in some economies than others.

    Using statistics for research and policy

    Policy researchers need reliable youth unemployment data to identify problems, design solutions, and measure outcomes. Several best practices improve analysis quality.

    Always examine trends over time rather than single data points. One quarter’s spike might reflect temporary factors. Multi-year patterns reveal structural issues.

    Compare youth rates to overall population rates. The gap between them indicates how much harder young people struggle relative to everyone else.

    Look at multiple indicators together. Unemployment rates, underemployment figures, labor force participation rates, and wage data create a complete picture. Any single metric can mislead.

    Consider economic context. Youth unemployment during a boom means something different than during a recession. Adjust expectations accordingly.

    Break down aggregate numbers by subgroups. Average youth unemployment might hide vastly different experiences for university graduates versus secondary school leavers, or for young men versus young women.

    Making sense of the numbers for your work

    Youth unemployment statistics provide essential insights for anyone working on labor market issues, education policy, or economic development. The data reveals who struggles to find work, which barriers they face, and how conditions change over time.

    For educators, these statistics highlight where curriculum needs updating. For economists, they signal structural problems requiring attention. For policymakers, they identify groups needing support and measure whether interventions work.

    The numbers represent real people facing real challenges. Behind every percentage point are individuals sending applications, attending interviews, and hoping for opportunities. Good statistics help us understand their experiences and create better pathways from education to employment.

    Check the latest releases regularly. Track trends in your areas of focus. Compare across regions and demographics. Use the data to ask better questions and design more effective solutions. Youth unemployment statistics aren’t just numbers on a page. They’re tools for building a labor market that works for everyone, especially those just starting out.

  • Does Social Welfare Spending Reduce Poverty? Analyzing Two Decades of Evidence

    The relationship between government spending and poverty outcomes has sparked debate for decades. Politicians promise programs. Economists crunch numbers. Communities wait for results. But what does the evidence actually tell us about whether social welfare spending reduces poverty?

    Key Takeaway

    Social welfare spending does reduce poverty, but effectiveness varies dramatically based on program design, targeting mechanisms, and economic context. Two decades of evidence show that direct cash transfers, coupled with employment support and healthcare access, produce the strongest poverty reduction outcomes. Countries spending 15 to 20 percent of GDP on social programs typically see poverty rates drop by 30 to 50 percent compared to pre-transfer levels.

    What the data reveals about welfare spending effectiveness

    Twenty years of comparative data paints a clear picture. Nations with robust social welfare systems consistently show lower poverty rates than those with minimal safety nets.

    The numbers tell a compelling story. Countries investing heavily in social protection see measurable results. Nordic nations spend roughly 25 to 30 percent of their GDP on social welfare programs and maintain poverty rates below 10 percent. Meanwhile, countries spending less than 10 percent of GDP often struggle with poverty rates exceeding 20 percent.

    But raw spending alone doesn’t guarantee success. The structure matters as much as the size.

    Hong Kong provides an interesting case study. Despite being one of the wealthiest cities globally, poverty rates remained stubbornly high for years. Social welfare spending hovered around 3 to 4 percent of GDP through the early 2000s. Poverty rates during this period exceeded 20 percent, particularly among elderly populations and families with children.

    When spending increased and programs became better targeted, outcomes shifted. The introduction of the Low Income Working Family Allowance in 2016 demonstrated how well designed interventions could move the needle. Poverty rates among working families dropped by approximately 3 percentage points within two years.

    Three mechanisms that make welfare spending work

    Understanding how social welfare reduces poverty requires looking beyond dollar amounts. Three core mechanisms drive effectiveness:

    1. Direct income supplementation fills the gap between earnings and basic needs. Cash transfers, food assistance, and housing subsidies immediately lift households above poverty thresholds.

    2. Human capital investment through education subsidies, healthcare access, and skills training breaks intergenerational poverty cycles. Children from supported families show better educational outcomes and higher lifetime earnings.

    3. Economic stabilization during downturns prevents temporary setbacks from becoming permanent poverty traps. Unemployment insurance and emergency assistance maintain consumption levels when jobs disappear.

    Each mechanism operates differently but contributes to overall poverty reduction. The most successful systems integrate all three rather than relying on a single approach.

    Program design features that determine success

    Not all welfare spending produces equal results. Design features separate effective programs from wasteful ones.

    Targeting accuracy determines whether resources reach those who need them most. Universal programs ensure coverage but may waste resources on higher income households. Means tested programs concentrate benefits but often miss eligible recipients or create administrative barriers.

    Benefit adequacy matters tremendously. Payments must be sufficient to actually reduce material hardship. Programs offering token amounts show minimal poverty impact. Research suggests benefits need to reach at least 40 to 50 percent of median income to meaningfully reduce poverty.

    Behavioral requirements can either enhance or undermine effectiveness. Work requirements may encourage employment but also exclude those unable to work. Educational requirements for child benefits improve long term outcomes but may reduce short term take up rates.

    Program Type Poverty Reduction Impact Administrative Cost Coverage Rate
    Universal basic income Moderate to high Low 95 to 100%
    Means tested cash transfers High Moderate to high 60 to 80%
    In kind benefits Low to moderate High 50 to 70%
    Conditional cash transfers High Moderate 65 to 85%
    Tax credits Moderate Low 40 to 60%

    The table illustrates trade offs inherent in different approaches. No single design dominates across all criteria.

    Common mistakes that reduce welfare effectiveness

    Even well intentioned programs can fail when implementation goes wrong. Several patterns repeatedly undermine poverty reduction efforts.

    Administrative complexity creates barriers that exclude eligible recipients. Application processes requiring extensive documentation, multiple office visits, or complex eligibility calculations reduce participation. Studies show that each additional form or verification step reduces take up rates by 5 to 15 percent.

    Benefit cliffs punish recipients for earning more. When a small income increase triggers complete benefit loss, families face effective marginal tax rates exceeding 100 percent. This traps people in poverty rather than supporting transitions to self sufficiency.

    Fragmented delivery forces families to navigate multiple agencies and programs. A single parent might need to apply separately for food assistance, housing support, childcare subsidies, and healthcare. Each program has different eligibility rules, application processes, and renewal schedules. This complexity exhausts recipients and wastes administrative resources.

    The most effective anti poverty programs share three characteristics: they provide adequate benefits, reach intended recipients efficiently, and integrate smoothly with employment. Programs missing any of these elements show dramatically reduced poverty impact regardless of spending levels.

    Political volatility undermines long term effectiveness. Programs that change dramatically with each election cycle fail to build the sustained support needed for poverty reduction. Families can’t plan when benefits might disappear. Service providers can’t invest in quality when funding fluctuates wildly.

    Why context shapes welfare spending outcomes

    The same program design produces different results in different settings. Economic conditions, labor markets, and social structures all influence effectiveness.

    Economic growth rates interact with welfare spending. During expansions, modest programs can successfully supplement earnings and reduce poverty. During recessions, the same spending level may prove inadequate as more people need support and unemployment rises.

    Labor market structure determines how welfare interacts with employment. In economies with abundant formal sector jobs, programs can focus on temporary support and skills training. In economies dominated by informal work, programs need different designs to reach workers without stable employers.

    Demographic composition affects program needs and costs. Aging populations require different mixes of support than young populations. Urban poverty differs from rural poverty. One size fits all approaches inevitably fail.

    Hong Kong’s experience illustrates these contextual factors. High housing costs mean that income thresholds adequate elsewhere leave families struggling. An aging population requires expanded elderly support. High inequality means poverty persists despite overall prosperity.

    Measuring what matters beyond poverty rates

    Headline poverty rates provide useful snapshots but miss important dimensions. Comprehensive evaluation requires multiple metrics.

    Poverty depth measures how far below the poverty line people fall. A program might not reduce the poverty rate but could substantially improve conditions for those remaining poor. This matters for wellbeing even if statistics don’t show it.

    Poverty duration distinguishes temporary hardship from persistent deprivation. Programs that help families exit poverty within months produce better outcomes than those where poverty stretches across years.

    Child outcomes offer the clearest window into long term program effectiveness. Children in families receiving adequate support show:

    • Better educational attainment
    • Improved health outcomes
    • Higher adult earnings
    • Lower involvement with criminal justice systems
    • Reduced intergenerational poverty transmission

    These outcomes justify welfare spending even when immediate poverty rate changes appear modest.

    Evidence from different welfare state models

    Countries have developed varied approaches to social welfare. Comparing models reveals what works under different conditions.

    Nordic universalism provides generous benefits to all citizens regardless of income. High tax rates fund comprehensive services. This approach produces the lowest poverty rates globally but requires substantial public spending and strong social consensus.

    Anglo-American selectivity targets benefits narrowly to the poorest households. Lower tax rates and spending levels appeal to voters skeptical of government. Poverty reduction proves more modest, and administrative costs run higher relative to benefits delivered.

    Continental insurance models tie benefits to employment and contributions. Workers receive generous support during unemployment or illness. Those outside formal employment receive less. This approach works well for core workers but leaves gaps for others.

    East Asian developmental states historically emphasized economic growth over redistribution. Social welfare spending remained low. Recent decades have seen gradual expansion as populations age and inequality rises. Effectiveness varies with implementation quality.

    No model clearly dominates. Each reflects different values, political economies, and historical paths. But all successful models share adequate funding, efficient administration, and political sustainability.

    The role of complementary policies

    Social welfare spending works best alongside other poverty reduction strategies. Isolated programs produce limited results.

    Minimum wage policies reduce the need for income supplementation. When wages cover basic needs, fewer families require assistance. But minimum wages set too high can reduce employment, particularly for less skilled workers.

    Affordable housing programs multiply the effectiveness of cash transfers. Housing costs consume 30 to 50 percent of low income household budgets in many cities. Without affordable housing, income support flows directly to landlords rather than improving family wellbeing.

    Healthcare access prevents medical costs from pushing families into poverty. Even generous income support fails if a single illness wipes out savings and creates debt. Universal healthcare or comprehensive insurance removes this threat.

    Quality education provides the foundation for economic mobility. Welfare spending stabilizes families so children can focus on learning. But if schools are inadequate, short term support won’t translate into long term opportunity.

    Building political support for effective programs

    Technical design means little without political sustainability. Programs need public support to survive and thrive.

    Visible results build constituencies. When voters see poverty declining and communities strengthening, they support continued investment. Programs that hide their impact struggle politically.

    Broad beneficiary bases create stronger coalitions than narrow targeting. Universal child allowances enjoy wider support than means tested assistance. Middle class families receiving benefits become advocates rather than critics.

    Administrative efficiency matters for public perception. Stories of waste and fraud undermine support faster than evidence of effectiveness builds it. Clean, efficient delivery protects programs politically.

    Economic framing influences acceptance. Programs described as investments in human capital or economic stabilizers gain more support than those framed as charity. The same spending receives different reactions depending on how it’s presented.

    What two decades of evidence teaches us

    The accumulated research provides clear lessons for policymakers and advocates.

    Social welfare spending does reduce poverty when programs are well designed, adequately funded, and efficiently administered. The question isn’t whether spending works but how to make it work better.

    Effective programs share common features. They provide sufficient benefits to meet basic needs. They reach intended recipients without excessive barriers. They integrate with employment rather than replacing it. They adapt to local contexts rather than imposing one size fits all solutions.

    Poor implementation can waste resources and undermine public support. Complex applications, benefit cliffs, fragmented delivery, and political volatility all reduce effectiveness. Avoiding these mistakes matters as much as increasing spending.

    Context shapes outcomes. The same program design produces different results in different economic, demographic, and institutional settings. Successful approaches require local adaptation rather than blind copying of foreign models.

    Complementary policies multiply impact. Welfare spending works best alongside minimum wages, affordable housing, healthcare access, and quality education. Isolated programs produce limited results.

    Making the evidence work for communities

    The data clearly shows that social welfare spending can substantially reduce poverty. But evidence alone doesn’t create change.

    Communities need advocates who understand what works and can push for effective programs. Policymakers need political cover to invest adequately and resist pressure for poorly designed alternatives. Administrators need resources and flexibility to implement efficiently.

    The question isn’t whether we can afford to reduce poverty through social welfare spending. Two decades of evidence show we can. The real question is whether we’ll choose to do so. The tools exist. The knowledge exists. What remains is the political will to apply both effectively.

    Your voice matters in this conversation. Whether you’re researching policy options, analyzing program effectiveness, or advocating for change, you now have the evidence to make informed arguments. Use it to push for programs that actually work, designed with care and funded adequately. Communities everywhere deserve nothing less.

  • What Do 20 Years of GDP Data Reveal About Hong Kong’s Economic Resilience?

    Two decades of economic data tell a story that numbers alone cannot capture. Hong Kong has faced financial crises, political upheaval, a global pandemic, and shifting trade relationships. Yet the city continues to function as one of Asia’s most important financial centers. Understanding this resilience requires looking beyond headline GDP figures to see how the economy adapts, absorbs shocks, and rebuilds.

    Key Takeaway

    Hong Kong’s economic resilience stems from its flexible labor market, deep capital reserves, strong legal framework, and strategic position in global trade. Twenty years of GDP data show repeated recoveries from major shocks, including the 2003 SARS outbreak, 2008 financial crisis, 2019 social unrest, and 2020 pandemic. The city’s ability to bounce back relies on institutional strength, diversified revenue streams, and rapid policy responses that stabilize markets during turbulent periods.

    What the numbers reveal about stability

    GDP growth rates fluctuate wildly during crisis years, but the pattern of recovery matters more than the depth of any single downturn. Between 2003 and 2023, Hong Kong experienced at least five major economic shocks. Each time, growth contracted sharply before rebounding within 12 to 18 months.

    The 2003 SARS epidemic caused GDP to contract by 4% in a single quarter. By 2004, growth had returned to 8.7%. The 2008 global financial crisis triggered a 2.5% annual contraction, yet 2010 saw 6.8% growth. More recently, the combined impact of social unrest in 2019 and the pandemic in 2020 pushed the economy into its deepest recession since records began. Still, partial recovery began in 2021.

    These patterns suggest that Hong Kong’s economic resilience depends less on avoiding shocks and more on institutional mechanisms that enable rapid stabilization. The currency peg to the US dollar provides monetary stability. Foreign exchange reserves exceeding $400 billion offer a buffer against capital flight. A low tax regime and minimal public debt give policymakers fiscal room to respond.

    How different sectors absorb economic shocks

    Not all parts of the economy respond the same way to external pressures. Financial services, trade and logistics, tourism, and professional services each show distinct patterns of vulnerability and recovery.

    Financial services account for roughly 20% of GDP. This sector proved remarkably stable during political tensions because global banks value Hong Kong’s legal system, time zone position, and access to mainland China. Even during the 2019 protests, major financial institutions maintained operations and capital flows remained robust.

    Trade and logistics suffered more during the US-China trade war. Re-export volumes declined as companies restructured supply chains. Yet the sector adapted by focusing on higher value services like supply chain management, quality control, and product customization rather than pure volume.

    Tourism represents the most volatile sector. Visitor arrivals can drop 50% or more during crises, as happened in 2003 and 2020. Recovery depends heavily on mainland China policy, since mainland visitors account for roughly 80% of total arrivals. When border restrictions ease, tourism rebounds within months.

    Professional services including legal, accounting, and consulting work show steady growth regardless of broader economic conditions. These services support cross-border transactions, regulatory compliance, and corporate restructuring. Demand actually increases during uncertain periods when companies need expert guidance.

    Three factors that determine recovery speed

    Economic resilience depends on specific structural features that allow rapid adjustment. Hong Kong possesses three critical advantages that accelerate recovery from downturns.

    1. Labor market flexibility enables companies to adjust costs without lengthy procedures. Hiring and firing regulations remain minimal compared to most developed economies. This allows businesses to scale operations up or down based on demand. During the 2020 pandemic, unemployment rose to 6.4% but fell back to 4.1% within 18 months as restrictions eased.

    2. Capital mobility ensures that investment flows respond immediately to changing conditions. No capital controls exist. Companies can repatriate profits, investors can move funds, and banks can adjust positions without government approval. This openness means capital returns as soon as conditions stabilize.

    3. Institutional credibility maintains confidence even during political uncertainty. The legal system operates independently. Property rights receive strong protection. Contracts get enforced reliably. These features matter more to long-term investors than short-term political headlines.

    “Economic resilience isn’t about preventing all shocks. It’s about having systems in place that allow rapid adjustment when shocks occur. Hong Kong’s open economy and strong institutions enable that adjustment faster than more controlled systems.” — Former Financial Secretary

    Measuring resilience beyond GDP growth

    Standard GDP figures miss important dimensions of economic health. A more complete picture requires examining multiple indicators that reveal underlying strength or weakness.

    Indicator What it reveals Hong Kong’s pattern
    Unemployment duration How fast people find new work Average 10-12 weeks even during downturns
    Corporate bankruptcy rate Business survival under stress Remains below 1% annually
    Foreign direct investment Long-term confidence Maintains top-5 global ranking
    Property price volatility Asset market stability High volatility but no systemic crashes
    Government debt to GDP Fiscal sustainability Consistently below 5%
    Banking system liquidity Financial system health Tier 1 capital ratios above 18%

    These metrics show that Hong Kong maintains strong fundamentals even when GDP growth turns negative. Businesses fail at low rates. People find work relatively fast. The financial system stays well capitalized. Government finances remain sound.

    Property prices deserve special attention because real estate represents such a large share of household wealth. Prices fluctuate significantly, sometimes dropping 20% or more during crises. Yet the market has never experienced a systemic crash requiring government bailouts. Strict lending standards and high down payment requirements prevent the kind of overleveraging that causes financial system failures.

    The role of policy responses in stabilization

    Government intervention during crises follows a consistent pattern. Policymakers avoid direct market interference but provide targeted support to maintain confidence and bridge temporary disruptions.

    During the 2003 SARS outbreak, the government launched stimulus measures worth 1.4% of GDP. These included tax rebates, fee waivers, and loan guarantees for small businesses. The measures aimed to maintain cash flow rather than prevent business failures.

    The 2008 financial crisis response focused on ensuring banking system liquidity. The government provided no direct bailouts but made clear that deposit insurance would be expanded if needed. This prevented bank runs while allowing market mechanisms to function.

    In 2020, the pandemic response included direct cash payments to residents, wage subsidies for employers, and rent relief for businesses. Total support exceeded 10% of GDP, the largest intervention in Hong Kong’s history. These measures prevented mass unemployment and business failures during lockdowns.

    Each intervention shared common features:

    • Temporary support rather than permanent subsidies
    • Broad eligibility to avoid picking winners
    • Automatic sunset provisions
    • Funding from fiscal reserves rather than borrowing
    • Clear communication about program limits

    This approach maintains market discipline while preventing cascading failures during acute crises. Companies that cannot survive even with temporary support exit the market. Those with viable business models receive breathing room to adjust.

    Structural changes that strengthen long-term resilience

    The economy has evolved significantly over 20 years in ways that enhance stability. Some changes resulted from deliberate policy choices. Others emerged from market forces and technological shifts.

    Financial services have become more sophisticated. Hong Kong now hosts the world’s largest offshore renminbi market. Stock market capitalization has grown from $400 billion in 2003 to over $4 trillion today. The city serves as the primary listing venue for Chinese companies accessing international capital.

    Professional services have expanded to support increasingly complex cross-border transactions. Legal services now include international arbitration, intellectual property disputes, and regulatory compliance across multiple jurisdictions. Accounting firms provide not just auditing but risk management and corporate restructuring services.

    Technology adoption has accelerated, particularly in financial services. Digital payment systems, algorithmic trading, and blockchain applications have all gained traction. While Hong Kong lags Singapore in some fintech areas, the technology infrastructure supports efficient markets and reduces transaction costs.

    Infrastructure investment has improved connectivity with mainland China. The Hong Kong-Zhuhai-Macau Bridge, high-speed rail links, and expanded border crossings integrate the city more deeply into the Greater Bay Area. This integration provides access to a market of 86 million people within a one-hour travel radius.

    Challenges that test future resilience

    Past performance does not guarantee future results. Several structural challenges could undermine Hong Kong’s ability to maintain its economic position and absorb future shocks.

    Geopolitical tensions between the United States and China create uncertainty for businesses operating across both markets. Companies face pressure to choose sides. Sanctions and counter-sanctions disrupt established relationships. Hong Kong’s role as a bridge between systems becomes more difficult when those systems actively conflict.

    Competition from other Asian financial centers has intensified. Singapore offers similar advantages with less political risk. Shanghai gains capabilities as China’s financial markets open. Tokyo positions itself as a stable alternative. Hong Kong must continuously improve its value proposition to retain business.

    Housing affordability has reached crisis levels. Property prices relative to income rank among the world’s highest. Young professionals struggle to build wealth. This creates social tensions and makes it harder to attract talent. Without addressing housing costs, the city risks losing its competitive edge in human capital.

    An aging population will strain public finances. The proportion of residents over 65 will double by 2040. Healthcare and social service costs will rise sharply. The working-age population will shrink. These demographic shifts require policy adjustments to maintain fiscal sustainability.

    Climate change poses physical risks to infrastructure and economic activity. Rising sea levels threaten reclaimed land. More intense typhoons disrupt business operations. Heat stress affects outdoor workers. Adaptation requires significant investment in resilient infrastructure.

    How businesses can build resilience strategies

    Companies operating in or through Hong Kong can learn from the city’s broader patterns of adaptation. Several practical approaches help businesses weather uncertainty while maintaining growth potential.

    Maintain financial buffers larger than normal business planning would suggest. Hong Kong companies that survived multiple crises typically held cash reserves covering at least six months of operating expenses. This cushion allows time to adjust without forced asset sales or emergency borrowing at unfavorable terms.

    Diversify customer and supplier relationships across multiple markets. Overreliance on any single geography creates vulnerability when that market faces disruption. Companies with balanced exposure across Asia, Europe, and North America proved more stable during trade conflicts and pandemic lockdowns.

    Invest in employee skills that remain valuable across different economic conditions. Technical expertise, language abilities, and cross-cultural competence enable staff to adapt when business models shift. Companies that maintained training budgets during downturns recovered faster because their workforce could handle new responsibilities.

    Build relationships with multiple financial institutions rather than relying on a single banking partner. Access to credit tightens during crises. Companies with established relationships across several banks found it easier to secure financing when individual institutions became cautious.

    Develop scenario plans for different types of disruptions. Companies that had already considered pandemic, political, and financial crisis scenarios adapted faster in 2020 because they had frameworks for decision making. These plans need not be detailed, but thinking through basic responses saves time when speed matters.

    What two decades of data tell us about the future

    Looking backward helps frame forward-looking questions. The past 20 years show that Hong Kong can absorb significant shocks and recover relatively quickly. But recovery speed has slowed with each successive crisis. The 2003 rebound took 12 months. The 2008 recovery needed 18 months. The post-2020 recovery remains incomplete after three years.

    This pattern suggests that each shock leaves residual damage that makes the system slightly more fragile. Capital that leaves during crises does not always return. Businesses that close do not always reopen. Talent that emigrates does not always come back. Resilience depends on maintaining the institutional features that enable adaptation while addressing the structural challenges that accumulate over time.

    The city’s economic future depends less on any single policy choice and more on whether it can maintain the characteristics that have enabled past recoveries: rule of law, fiscal prudence, market openness, and institutional credibility. These features took decades to build. They can erode more quickly than they were established.

    Making sense of resilience in uncertain times

    Economic data provides a foundation for understanding how systems respond to stress, but numbers alone cannot capture the human dimensions of resilience. Behind every GDP figure are businesses that closed and others that adapted. Families that struggled and others that found opportunity. Workers who lost jobs and others who gained new skills.

    Hong Kong’s economic resilience over 20 years reflects both structural advantages and conscious choices by policymakers, businesses, and individuals. The advantages include geography, infrastructure, and institutions built over generations. The choices involve how to respond when circumstances change, whether to maintain openness or retreat, whether to invest in adaptation or preserve existing arrangements.

    The next 20 years will test whether these patterns continue. New challenges will emerge. Some will resemble past shocks. Others will be unprecedented. The capacity to respond effectively depends on learning from previous experiences while remaining flexible enough to handle novel situations.

    For those analyzing Hong Kong’s economy, the lesson is clear: resilience is not a fixed characteristic but an ongoing process of adaptation. It requires maintaining core strengths while continuously adjusting to changing conditions. The data from two decades of economic performance shows this process in action, with all its successes and continuing challenges.

  • 7 Critical Indicators That Define Poverty in Hong Kong Beyond Income Levels

    7 Critical Indicators That Define Poverty in Hong Kong Beyond Income Levels

    Measuring poverty by income alone paints an incomplete picture. In Hong Kong, where living costs rank among the world’s highest and inequality continues to widen, understanding who struggles requires a multidimensional approach. The city’s official poverty line captures one aspect of hardship, but real deprivation shows up in housing quality, educational access, health outcomes, and social participation.

    Key Takeaway

    Hong Kong uses seven poverty indicators beyond income to measure deprivation: housing conditions, educational attainment, employment quality, health access, digital connectivity, food security, and social inclusion. These metrics reveal that 1.4 million residents face poverty when measured multidimensionally, compared to income measures alone. Understanding these indicators helps policymakers design targeted interventions that address root causes rather than symptoms.

    Why income alone misses the full story

    Traditional poverty measurement focuses on median household income thresholds. Hong Kong’s official poverty line sits at 50% of median monthly household income before policy intervention. A four-person household falls below this line when earning less than HK$20,800 monthly.

    But income tells only part of the story.

    Two families earning identical wages can experience vastly different living standards. One might live in subdivided units with poor ventilation. The other might access public housing with adequate space. One child might attend well-resourced schools. Another might lack internet access for homework.

    These differences matter enormously for wellbeing and opportunity.

    The Social Development Index tracks multiple dimensions because poverty manifests through interconnected deprivations. Someone might earn above the poverty line yet struggle with chronic illness, inadequate housing, or social isolation. Each factor compounds the others.

    Housing conditions as a poverty marker

    7 Critical Indicators That Define Poverty in Hong Kong Beyond Income Levels - Illustration 1

    Housing quality serves as one of the most visible poverty indicators Hong Kong residents face daily.

    Subdivided units, cage homes, and rooftop structures house over 220,000 people. These spaces average 48 square feet per person, less than half a standard parking space. Families cook, sleep, study, and live in single rooms without proper ventilation or natural light.

    The health implications run deep:

    • Respiratory infections spread rapidly in cramped quarters
    • Mental health deteriorates without private space
    • Children lack quiet areas for studying
    • Elderly residents face mobility hazards

    Housing costs consume disproportionate shares of low-income budgets. Families earning HK$10,000 monthly often spend HK$4,000 to HK$5,000 on rent alone. This leaves minimal resources for food, healthcare, or education.

    Public housing waitlists stretch beyond six years for general applicants. During this waiting period, families cycle through temporary arrangements that destabilize employment, schooling, and social networks.

    Housing is not just shelter. It determines health outcomes, educational achievement, employment stability, and social participation. Measuring poverty without assessing housing conditions ignores a fundamental dimension of wellbeing.

    Educational access and attainment gaps

    Educational inequality perpetuates poverty across generations. While Hong Kong provides free primary and secondary education, significant disparities emerge in educational quality and support.

    Students from low-income families face multiple barriers:

    1. Limited access to tutorial services that middle-class peers use routinely
    2. Inadequate study space at home due to housing constraints
    3. Inability to afford extracurricular activities that build skills
    4. Digital divides that became critical during remote learning periods
    5. Nutritional deficits that affect concentration and attendance

    Secondary school completion rates vary dramatically by income quartile. Among the poorest 20% of households, only 68% of young adults complete secondary education, compared to 94% from the wealthiest quintile.

    Tertiary education remains financially prohibitive despite loan programs. Students from disadvantaged backgrounds graduate with larger debt burdens and often work part-time during studies, reducing academic performance and networking opportunities.

    The intergenerational impact compounds over time. Parents with limited education face employment barriers, creating household stress that affects children’s academic outcomes, perpetuating the cycle.

    Employment quality beyond wage levels

    7 Critical Indicators That Define Poverty in Hong Kong Beyond Income Levels - Illustration 2

    Having a job does not guarantee escape from poverty. Employment quality matters as much as employment status.

    Hong Kong’s working poor population exceeds 500,000 people. These individuals hold jobs yet earn insufficient income to meet basic needs. Many work in sectors characterized by:

    • Irregular hours without guaranteed minimum shifts
    • No paid sick leave or annual leave
    • Limited workplace safety protections
    • Few opportunities for skill development or advancement
    • Vulnerability to sudden termination without cause

    The gig economy has expanded precarious work arrangements. Delivery drivers, cleaners, security guards, and retail workers often piece together multiple part-time positions without benefits or job security.

    Employment Type Average Monthly Income Job Security Benefits Coverage
    Permanent full-time HK$18,500 High Comprehensive
    Contract position HK$14,200 Medium Partial
    Part-time multiple jobs HK$9,800 Low Minimal
    Gig/platform work HK$8,400 Very low None

    Underemployment affects poverty as severely as unemployment. Workers with skills and qualifications who can only find low-wage positions experience income poverty plus the psychological toll of underutilization.

    Health access and outcomes

    Healthcare accessibility reveals another critical poverty dimension. Hong Kong’s public healthcare system provides subsidized services, yet significant barriers prevent equal access.

    Wait times for specialist consultations in public hospitals can extend 18 to 24 months for non-urgent conditions. During this period, conditions worsen, productivity declines, and quality of life deteriorates.

    Low-income residents often delay seeking care due to:

    • Transportation costs to medical facilities
    • Lost wages from taking time off work
    • Inability to afford prescribed medications not covered by subsidies
    • Lack of health literacy to navigate the system effectively

    Chronic disease prevalence correlates strongly with income levels. Diabetes, hypertension, and cardiovascular conditions occur at higher rates among lower-income populations, partly due to diet, stress, and environmental factors.

    Mental health services remain particularly inaccessible. Public psychiatric services face overwhelming demand while private counseling costs HK$800 to HK$1,500 per session, prohibitive for most low-income individuals.

    The health-poverty connection runs both directions. Poor health limits employment opportunities and earning capacity. Low income restricts health-promoting resources like nutritious food, safe housing, and preventive care.

    Digital connectivity and information access

    The digital divide emerged as a stark poverty indicator during the COVID-19 pandemic. When schools shifted online, students without computers or stable internet faced immediate educational disadvantage.

    But digital exclusion predated and extends beyond pandemic disruptions.

    Approximately 180,000 Hong Kong households lack home internet access. Another 250,000 rely solely on mobile data plans with limited capacity. For students, job seekers, and workers, this creates cascading disadvantages:

    • Students cannot complete assignments requiring research or typing
    • Job seekers miss online-only application opportunities
    • Workers cannot access training programs or remote work options
    • Families pay more for goods and services unavailable at online discounts

    Government services increasingly move online, from housing applications to tax filing to benefit enrollment. Those without digital access face longer processing times, missed deadlines, and reduced service quality.

    The cost barrier remains significant. A basic home internet plan costs HK$120 to HK$180 monthly, representing 5% to 8% of income for families at the poverty line. Computers or tablets add upfront costs of HK$3,000 to HK$8,000.

    Digital literacy compounds access issues. Older residents and recent immigrants may have internet access but lack skills to use online services effectively, creating functional exclusion despite technical connectivity.

    Food security and nutritional adequacy

    Food insecurity affects approximately 400,000 Hong Kong residents who regularly skip meals, reduce portion sizes, or rely on the cheapest, least nutritious options.

    The manifestations vary:

    • Families eating rice with soy sauce as complete meals
    • Children arriving at school without breakfast
    • Elderly residents choosing between medication and food
    • Parents feeding children while going hungry themselves

    Food prices in Hong Kong rank among the highest globally. A basic nutritious diet costs approximately HK$50 per person daily, totaling HK$6,000 monthly for a family of four. This represents 60% of income for households at the poverty line.

    Food assistance programs provide critical support but cannot meet full demand. Food banks report turning away applicants due to supply limitations. School lunch subsidies help but do not cover dinners, weekends, or school holidays.

    Nutritional quality suffers most. Fresh vegetables, fruits, and protein sources cost significantly more than instant noodles, white rice, and processed foods. Low-income families consume diets high in refined carbohydrates and sodium but deficient in vitamins, minerals, and protein.

    The health consequences appear in higher rates of anemia, stunted growth in children, and diet-related chronic diseases. These health impacts then create additional economic burdens, perpetuating poverty.

    Social participation and inclusion

    Social exclusion represents perhaps the least visible yet most damaging poverty dimension. Inability to participate in normal social activities isolates individuals and limits opportunities.

    Children from low-income families often cannot:

    • Join school trips requiring fees
    • Participate in sports requiring equipment or uniforms
    • Attend classmates’ birthday celebrations with appropriate gifts
    • Engage in extracurricular activities that build friendships

    This exclusion affects self-esteem, peer relationships, and social skill development. Children internalize shame about their circumstances, affecting mental health and academic motivation.

    Adults face similar barriers. Social gatherings often involve expenses for meals, transportation, or activities that low-income individuals cannot afford. Over time, invitations decrease and social networks shrink.

    Community participation requires resources. Volunteering opportunities may require transportation costs. Civic engagement meetings occur during work hours. Cultural events charge admission fees.

    The psychological impact of social exclusion compounds material deprivation. Isolation increases depression and anxiety rates. Reduced social networks limit access to job information, mutual support, and collective advocacy.

    Measuring poverty comprehensively

    The seven poverty indicators Hong Kong uses create a multidimensional picture that income alone cannot capture. Researchers and policymakers increasingly recognize that deprivation manifests through interconnected disadvantages.

    Someone experiencing three or more of these indicators faces severe multidimensional poverty:

    1. Housing inadequacy (overcrowding, poor conditions, unaffordable rent)
    2. Educational barriers (incomplete schooling, lack of learning resources)
    3. Employment precarity (unstable work, insufficient income, no benefits)
    4. Health access limitations (delayed care, untreated conditions, poor outcomes)
    5. Digital exclusion (no internet access, inadequate devices, low literacy)
    6. Food insecurity (insufficient quantity, poor quality, skipped meals)
    7. Social isolation (inability to participate, limited networks, exclusion)

    Data shows that 42% of income-poor households also experience at least two additional deprivations. This overlap demonstrates how disadvantages cluster and reinforce each other.

    The multidimensional approach also identifies vulnerabilities among those above the income poverty line. Approximately 300,000 Hong Kong residents earn sufficient income yet face severe deprivation in housing, health, or social inclusion.

    Policy implications and intervention design

    Understanding poverty through multiple indicators transforms how interventions get designed and evaluated.

    Income transfers alone cannot address housing quality, educational gaps, or social exclusion. Effective poverty reduction requires coordinated approaches:

    • Housing policy that prioritizes affordability and adequate living standards
    • Educational support that includes tutoring, meals, and extracurricular access
    • Employment programs that emphasize job quality and worker protections
    • Healthcare expansion that reduces wait times and covers essential services
    • Digital inclusion initiatives providing devices, connectivity, and training
    • Food security programs ensuring nutritional adequacy, not just calories
    • Community development that builds social capital and participation opportunities

    Evaluation metrics must track changes across all dimensions. A policy that raises incomes but worsens housing stress or reduces social participation may not improve overall wellbeing.

    The interconnected nature of poverty indicators suggests that interventions addressing multiple dimensions simultaneously create synergistic benefits. For example, improved housing quality enhances health outcomes, educational achievement, and employment stability.

    Data collection and monitoring challenges

    Tracking multidimensional poverty requires robust data systems that many jurisdictions lack. Hong Kong faces several measurement challenges:

    • Inconsistent data collection across different government departments
    • Privacy concerns limiting data sharing and integration
    • Lag times between data collection and policy application
    • Difficulty capturing informal or hidden populations
    • Subjective elements in measuring social exclusion or wellbeing

    The Social Development Index addresses some gaps by compiling indicators from multiple sources. However, comprehensive poverty monitoring requires sustained investment in data infrastructure and interdepartmental coordination.

    Longitudinal data proves particularly valuable. Tracking individuals and families over time reveals poverty dynamics: who exits poverty, who falls into it, and what factors drive these transitions. This information guides prevention and intervention timing.

    Community-based participatory research complements official statistics. People experiencing poverty provide insights that administrative data cannot capture about daily challenges, coping strategies, and intervention effectiveness.

    Moving beyond income-focused solutions

    The evidence is clear. Poverty in Hong Kong extends far beyond insufficient income. Housing conditions, educational access, employment quality, health outcomes, digital connectivity, food security, and social inclusion all define whether people can meet basic needs and participate fully in society.

    Policymakers, researchers, and practitioners increasingly recognize that effective poverty reduction requires multidimensional strategies. Income support remains important but insufficient without addressing the structural factors that create and perpetuate deprivation.

    For academic researchers, these seven indicators provide frameworks for investigating poverty dynamics and evaluating interventions. For policy analysts, they offer metrics for assessing program effectiveness across multiple wellbeing dimensions. For social workers and NGO professionals, they highlight the interconnected challenges clients face and the need for holistic support.

    Understanding poverty through multiple lenses does not just improve measurement accuracy. It fundamentally changes how we think about solutions, moving from narrow income transfers toward comprehensive approaches that address root causes and build genuine opportunity for all Hong Kong residents.

  • Understanding the Working Poor: Employment Statistics That Challenge Common Assumptions

    Millions of people clock in every day, work full shifts, and still struggle to afford basic needs. The working poor are not a small group. They are not lazy. They are not unemployed. They hold jobs, sometimes multiple jobs, and yet poverty defines their daily reality.

    Key Takeaway

    Working poor statistics reveal that employment alone does not guarantee financial security. Across Hong Kong and globally, millions of workers earn wages too low to escape poverty. Understanding these data patterns helps researchers, journalists, and advocates challenge stereotypes, identify vulnerable groups, and push for policies that address wage stagnation, underemployment, and structural inequality affecting low-income workers.

    Who counts as working poor

    Defining the working poor matters because it shapes how we measure the problem and design solutions.

    Most definitions focus on people who spend at least half the year in the labor force but still live below the poverty line. That means working or actively looking for work for 27 weeks or more, yet earning income insufficient to meet basic needs.

    Some frameworks use relative poverty thresholds. A household earning less than 50% of the median income qualifies as poor, regardless of employment status. When workers fall into this category, they become part of the working poor.

    Other measures emphasize expenditure. If a household spends more than 60% of income on housing, food, and transport, financial stress becomes chronic. Employment does not shield them from hardship.

    Age, family size, and regional cost of living all influence these calculations. A single worker in a rural area faces different poverty risks than a parent of three in an expensive city.

    Numbers that challenge common beliefs

    Understanding the Working Poor: Employment Statistics That Challenge Common Assumptions - Illustration 1

    Statistics often contradict what people assume about poverty and work.

    In Hong Kong, nearly one in five employed individuals lives in poverty. That translates to hundreds of thousands of workers who cannot afford stable housing, healthcare, or education for their children despite holding jobs.

    Full-time employment does not eliminate poverty risk. Data shows that many working poor hold full-time positions. They are not underemployed by hours. They are underpaid by wage.

    Women face higher rates of working poverty than men. Gender wage gaps, occupational segregation, and caregiving responsibilities all contribute. Women cluster in lower-paid sectors like retail, hospitality, and domestic work.

    Young workers and older workers both experience elevated poverty rates. Youth enter the labor market with limited bargaining power and few skills. Older workers face age discrimination and limited retraining opportunities.

    Education does not guarantee escape. While higher education correlates with better wages, many degree holders still earn poverty-level incomes. Credential inflation and mismatched skills reduce the protective effect of schooling.

    Industries where working poverty clusters

    Certain sectors concentrate low-wage workers at much higher rates than others.

    Sector Poverty risk factors Typical wage range
    Retail and sales Part-time hours, commission-based pay, limited benefits Below median
    Food service Irregular shifts, tip dependency, high turnover Lowest quartile
    Cleaning and maintenance Contract work, no job security, minimal advancement Below median
    Security services Long hours, low hourly rates, limited training Below median
    Elderly care Emotional labor, physical demands, undervaluation Below median

    Retail workers often face unpredictable schedules. Employers adjust hours week by week, making budgeting nearly impossible. Workers cannot plan childcare, education, or second jobs.

    Food service relies heavily on tips and variable shifts. Base wages sit at legal minimums. Tips fluctuate with seasons, economic conditions, and customer demographics.

    Cleaning and maintenance jobs frequently operate through subcontractors. Workers lack direct employment relationships with the organizations they serve. Benefits disappear. Job security evaporates.

    Security guards work long shifts but earn low hourly wages. Overnight premiums rarely compensate for the health costs of disrupted sleep and social isolation.

    Elderly care workers provide essential services yet receive minimal pay. Society undervalues care work, especially when performed by women or migrants.

    Household composition and poverty dynamics

    Understanding the Working Poor: Employment Statistics That Challenge Common Assumptions - Illustration 2

    Family structure shapes poverty risk in powerful ways.

    Single-parent households face the highest working poverty rates. One income supports multiple people. Childcare costs consume large portions of earnings. Time constraints limit overtime and second jobs.

    Multi-generational households sometimes buffer poverty through shared expenses. Grandparents provide childcare. Adult children contribute income. But overcrowding and stress often accompany these arrangements.

    Dual-income households are not immune. When both partners earn low wages, combined income still falls short. Childcare, transport, and work-related expenses reduce net income significantly.

    Households with disabled members experience compounded challenges. Caregiving reduces available work hours. Medical expenses drain savings. Accessible housing costs more.

    Migrant workers often send remittances home, reducing their own consumption. They live in shared accommodation, skip meals, and forgo healthcare to support families abroad.

    Geographic patterns in working poverty

    Location determines opportunity and cost.

    Urban centers offer more jobs but charge higher rents. Workers spend hours commuting from affordable neighborhoods to job centers. Transport costs eat into wages.

    Rural areas provide cheaper housing but fewer employment options. Jobs cluster in agriculture, tourism, or resource extraction. Wages lag behind urban rates. Services like healthcare and education require travel.

    Suburban districts trap workers between high costs and limited transit. Car ownership becomes necessary but expensive. Insurance, fuel, and maintenance add up.

    Public housing availability varies dramatically by region. Long waiting lists mean workers spend years in private rentals, paying market rates on poverty wages.

    Proximity to family networks matters. Workers near relatives access informal childcare, meal sharing, and emergency support. Those far from kin face isolation and higher costs.

    Policy interventions that move the needle

    Evidence shows which approaches actually reduce working poverty.

    1. Minimum wage increases tied to cost of living indices prevent erosion of purchasing power over time.
    2. Earned income tax credits supplement low wages without discouraging employment.
    3. Affordable childcare subsidies enable parents to work more hours and accept better jobs.
    4. Public transport subsidies reduce the effective cost of commuting for low-wage workers.
    5. Skills training programs with employer partnerships create pathways to higher-paying roles.

    Minimum wage laws work best when adjusted regularly. Static rates lose value to inflation. Workers fall behind even while working the same hours.

    Tax credits deliver income support without creating welfare traps. Workers keep more of what they earn. Benefits phase out gradually as income rises.

    Childcare costs often exceed rent for families with young children. Subsidized care removes a major barrier to employment and advancement.

    Transport subsidies matter most in sprawling cities. Workers can accept jobs farther from home without losing income to fares.

    Training programs succeed when tied to actual hiring. Partnerships with employers ensure skills match demand. Credentials lead to real job offers.

    Effective anti-poverty policy recognizes that work alone does not solve poverty. Wages must cover basic needs. Support systems must fill gaps. Opportunity must be accessible to all workers, regardless of sector or background.

    Data gaps and measurement challenges

    Current statistics undercount and misrepresent working poverty in several ways.

    Informal work escapes official counts. Gig workers, cash-paid laborers, and undocumented workers rarely appear in surveys. Their poverty remains invisible to policymakers.

    Self-employment complicates income measurement. Earnings fluctuate. Expenses blur the line between business and personal costs. Poverty status changes month to month.

    In-kind benefits and informal support do not show up in income data. Households receiving free childcare from relatives or meals from community programs have higher effective income than statistics suggest.

    Asset poverty differs from income poverty. Workers with low wages but family wealth face different constraints than those without any safety net.

    Temporary poverty spells versus chronic poverty require different responses. Workers who experience brief poverty after job loss need different support than those stuck in low-wage careers for decades.

    Breaking stereotypes through data

    Numbers correct harmful misconceptions about the working poor.

    • Most working poor are not teenagers earning pocket money. They are adults supporting families.
    • Working poverty affects citizens and long-term residents, not just recent immigrants.
    • Education and effort do not guarantee escape when wages stagnate and costs rise.
    • Full-time work does not prevent poverty when hourly rates fall below living wage thresholds.
    • Working poor households often include multiple earners, not single unemployed adults.

    Media narratives often blame individuals for poverty. Statistics reveal structural causes. Wage floors matter more than work ethic. Housing policy shapes outcomes more than personal choices.

    Stereotypes about laziness crumble when data shows working poor logging more hours than higher-income workers. Many hold multiple jobs. They work nights, weekends, and holidays.

    Assumptions about immigration distort reality. Native-born workers experience working poverty at significant rates. The problem crosses citizenship lines.

    Beliefs that education solves everything ignore credential inflation and sector-specific wage ceilings. Degrees help but do not guarantee middle-class incomes.

    Tracking trends over time

    Historical data reveals how working poverty evolves with economic shifts.

    The 1990s saw working poverty decline in many developed economies. Strong growth, tight labor markets, and rising minimum wages lifted incomes.

    The 2008 financial crisis reversed progress. Job losses, wage cuts, and austerity measures pushed more workers into poverty. Recovery took years and bypassed many low-wage sectors.

    Automation and globalization changed the composition of working poverty. Manufacturing jobs disappeared. Service sector jobs expanded but paid less. Middle-skill jobs hollowed out.

    The COVID-19 pandemic exposed and worsened working poverty. Essential workers faced health risks without hazard pay. Service workers lost jobs entirely. Recovery remains uneven.

    Recent inflation surges eroded real wages. Workers saw paychecks grow nominally but shrink in purchasing power. Rent, food, and energy costs outpaced wage increases.

    Comparing Hong Kong to global patterns

    Hong Kong’s working poverty statistics reflect both unique local factors and broader global trends.

    High housing costs distinguish Hong Kong from most other cities. Rent consumes a larger share of income than almost anywhere else. Workers earning median wages still struggle with housing.

    Strong social safety nets in Nordic countries keep working poverty rates low. Universal childcare, healthcare, and education reduce the income needed to avoid poverty.

    The United States shows high working poverty despite high GDP per capita. Weak labor protections, expensive healthcare, and limited social programs leave many workers vulnerable.

    East Asian economies share some patterns with Hong Kong. Rapid development, income inequality, and limited welfare states create similar challenges.

    Latin American countries often have higher informal employment rates. Working poverty statistics undercount the true scale because so many workers operate outside formal systems.

    Using statistics for advocacy and policy change

    Data becomes powerful when translated into action.

    Researchers can identify which worker groups face highest risk. Targeted interventions reach those who need help most.

    Journalists can use statistics to humanize abstract policy debates. Numbers paired with personal stories create compelling narratives.

    Advocates can counter false claims with evidence. When opponents blame individuals, data reveals structural causes.

    Policymakers can track intervention effectiveness. Statistics show whether programs reduce poverty or waste resources.

    Students can build research projects around working poverty data. Fresh analysis generates new insights and career opportunities.

    Making sense of the numbers

    Working poor statistics challenge the myth that employment guarantees security. Millions of people work hard, follow rules, and still cannot afford basic dignity.

    The data points to clear solutions. Raise wage floors. Reduce housing costs. Subsidize childcare and transport. Invest in skills that lead to real jobs.

    Understanding these statistics helps everyone see poverty as a policy choice, not an individual failure. When we measure the problem accurately, we can solve it effectively.

  • How Income Inequality in Hong Kong Has Evolved Over Three Decades

    How Income Inequality in Hong Kong Has Evolved Over Three Decades

    Hong Kong stands as one of the world’s wealthiest cities, yet it also carries one of the widest wealth gaps among developed economies. For over thirty years, the divide between rich and poor has widened, reshaping neighborhoods, opportunities, and everyday life for millions of residents. Understanding how this gap emerged and evolved helps us see not just numbers on a chart, but real stories of families, workers, and communities.

    Key Takeaway

    Income inequality in Hong Kong has grown significantly since 1991, driven by economic restructuring, housing costs, and wage stagnation. The Gini coefficient rose from 0.476 in 1991 to over 0.539 by 2016, marking one of the highest levels among developed regions. Policy interventions have had limited success in reversing this trend, though recent measures show modest improvements in targeted areas.

    How the wealth gap took shape in the 1990s

    The early 1990s marked a turning point for Hong Kong’s economy. Manufacturing jobs moved to mainland China, leaving behind a service-based economy that favored highly educated workers. Factory workers who once earned stable middle-class incomes found themselves competing for lower-paying retail and hospitality positions.

    Between 1991 and 2001, the city’s Gini coefficient climbed from 0.476 to 0.525. This jump reflected a labor market splitting into two camps: high earners in finance, real estate, and professional services, and low earners in support roles with little room for advancement.

    Property prices also began their long climb during this decade. Homeownership became harder to achieve for working families, pushing more households into public housing or subdivided flats. The wealth you could build through property ownership became a key driver of inequality, separating those who bought early from those priced out forever.

    The 2000s brought deeper divides

    How Income Inequality in Hong Kong Has Evolved Over Three Decades - Illustration 1

    The decade following the handover to China saw economic growth, but the benefits flowed unevenly. Financial services boomed, creating millionaires and billionaires at a rapid pace. At the same time, wages for cleaners, security guards, and food service workers barely kept up with inflation.

    By 2011, the Gini coefficient reached 0.537, one of the highest readings among advanced economies. The gap between the top 10% and bottom 10% of earners widened to a ratio of more than 40 to 1 before taxes and transfers.

    Three factors drove this trend:

    1. Globalization rewarded specialized skills and punished routine labor
    2. Automation reduced demand for middle-skill jobs in clerical and administrative work
    3. Immigration policies brought in both high-paid expatriates and low-wage domestic helpers, stretching both ends of the income spectrum

    Public housing waitlists grew longer. Families waited five years or more for affordable units. Those stuck in the private rental market spent 40% or more of their income on cramped apartments, leaving little for savings or education.

    What the data reveals about wealth concentration

    Looking at household income distribution paints a stark picture. The table below shows how income shares shifted over three decades:

    Income Group 1991 Share 2001 Share 2016 Share
    Bottom 20% 5.4% 4.8% 4.1%
    Middle 20% 11.2% 10.5% 9.8%
    Top 20% 47.3% 50.1% 52.7%

    The top fifth of households claimed more than half of all income by 2016, while the bottom fifth saw their share shrink below 5%. Middle-income households also lost ground, squeezed by rising costs and stagnant wages.

    Wealth concentration tells an even sharper story. Property ownership, stock portfolios, and business assets cluster heavily among the top 10%. A 2017 study found that the wealthiest 10% of Hong Kong households controlled more than 70% of total net worth.

    How housing costs amplified the divide

    How Income Inequality in Hong Kong Has Evolved Over Three Decades - Illustration 2

    No discussion of income inequality in Hong Kong makes sense without addressing housing. Property prices tripled between 2003 and 2018, far outpacing income growth. A typical middle-class family in 2018 needed to save their entire income for 20 years to afford a median-priced apartment, compared to 12 years in 2003.

    This created a two-tier society:

    • Homeowners who bought before 2000 saw their net worth multiply
    • Renters and late buyers faced permanent affordability challenges
    • Young professionals delayed marriage and children due to housing costs
    • Elderly renters lived in unsafe subdivided units with no retirement savings

    The government’s public housing program helped some families, but supply never matched demand. Private developers controlled land supply and had little incentive to build affordable units. The result was a housing market that functioned as a wealth transfer mechanism from young to old, from poor to rich.

    Policy responses and their limited impact

    Authorities introduced several measures to address growing inequality, with mixed results. The Minimum Wage Ordinance took effect in 2011, setting a floor for hourly pay. Initial rates started at HK$28 per hour and rose gradually to HK$37.50 by 2019.

    These wage floors helped the lowest earners but did little to close the broader gap. Many employers simply capped hours or shifted to part-time contracts. The minimum wage also didn’t apply to domestic helpers, excluding a significant portion of low-wage workers.

    Tax policy remained regressive. Hong Kong’s simple tax system with low rates and few brackets meant high earners paid a smaller share of their income than in most developed countries. A top marginal rate of 17% on salaries and a 15% corporate rate created minimal redistribution through the tax system.

    Addressing income inequality requires more than minimum wage adjustments. We need structural reforms in housing supply, progressive taxation, and investments in education and retraining for workers displaced by economic shifts.

    Social welfare spending increased, particularly for elderly support and disability services. Cash transfer programs like the Old Age Living Allowance provided modest monthly payments to seniors. These helped reduce poverty among the elderly but had little effect on working-age inequality.

    Recent trends show stubborn persistence

    The most recent data from 2016 to 2021 shows the Gini coefficient hovering around 0.539 before government intervention. After accounting for taxes and transfers, it drops to approximately 0.473, still higher than most OECD countries.

    Several factors keep inequality elevated:

    • The rise of the gig economy created more precarious work arrangements
    • Automation eliminated mid-level jobs in retail and customer service
    • Cross-border integration with mainland China increased competition for certain jobs while creating opportunities for others
    • Educational attainment gaps widened as wealthy families invested heavily in tutoring and international schools

    The COVID-19 pandemic hit low-income workers hardest. Restaurant staff, retail workers, and tourism employees faced layoffs and reduced hours. Professional workers often transitioned to remote work with minimal income disruption. Government relief programs provided temporary support but didn’t address underlying structural issues.

    Comparing Hong Kong to regional peers

    How does Hong Kong’s inequality compare to other Asian economies? Singapore, often seen as a comparable city-state, maintains a Gini coefficient around 0.45 after transfers, lower than Hong Kong despite similar economic structures. Singapore’s approach includes more aggressive public housing provision, with over 80% of residents living in government-built flats they can purchase at subsidized rates.

    South Korea and Taiwan both show lower inequality measures, partly due to stronger manufacturing sectors that provide middle-class jobs. Japan maintains relatively low inequality through lifetime employment practices and compressed wage structures, though these norms are weakening.

    Mainland Chinese cities show varied patterns. Beijing and Shanghai have high inequality but lower than Hong Kong. Shenzhen, just across the border, has grown rapidly with inequality levels approaching Hong Kong’s, driven by similar dynamics in tech and finance sectors.

    What drives persistent inequality

    Three structural forces keep the wealth gap wide:

    1. Economic structure: A service-dominated economy with limited manufacturing means fewer middle-skill, middle-wage jobs. Finance and professional services reward top performers generously while support roles offer minimal advancement.

    2. Land and housing policy: Government control of land supply, combined with developer oligopolies, keeps property prices artificially high. This transfers wealth from renters to owners and creates barriers to social mobility.

    3. Tax and transfer system: Low tax rates and minimal redistribution mean market income inequality translates almost directly into disposable income inequality. Unlike European welfare states, Hong Kong does little to compress the income distribution through fiscal policy.

    Educational inequality also plays a role. Children from wealthy families attend elite international schools and overseas universities, while working-class kids attend local schools with fewer resources. This creates a self-perpetuating cycle where advantages compound across generations.

    Measuring beyond the Gini coefficient

    While the Gini coefficient provides a useful summary statistic, other measures reveal additional dimensions of inequality. The Palma ratio, which compares the income share of the top 10% to the bottom 40%, shows an even starker picture for Hong Kong. By this measure, the city ranks among the most unequal places globally.

    Wealth inequality exceeds income inequality by a wide margin. The ratio of median net worth between the top and bottom quintiles stretches beyond 100 to 1. Many low-income households have zero or negative net worth due to debt and lack of assets.

    Intergenerational mobility has declined. A child born into a low-income family in Hong Kong today has less chance of reaching the top income quintile than their counterpart in 1980. Educational sorting, housing costs, and network effects all contribute to reduced mobility.

    Looking at inequality through different lenses

    Gender adds another layer to income disparities. Women in Hong Kong earn approximately 20% less than men for comparable work, a gap that has narrowed only slightly over three decades. Occupational segregation keeps women concentrated in lower-paying sectors like retail, education, and care work.

    Age patterns shifted over time. In the 1990s, middle-aged workers enjoyed peak earnings while young and old earned less. Today, the age-earnings profile has flattened for many workers. Young professionals face delayed career progression, while older workers without property wealth struggle with inadequate retirement savings.

    Immigration status matters significantly. Foreign domestic helpers, numbering over 350,000, earn fixed wages below the minimum wage floor. They provide essential care services but remain excluded from many labor protections and social benefits.

    Understanding the human cost

    Statistics tell only part of the story. Behind the numbers are families making difficult choices. Parents work two jobs to afford tutoring for their children. Young couples delay having kids because a two-bedroom apartment costs their combined annual salary times 20. Elderly residents sort cardboard for recycling to supplement meager pensions.

    Subdivided flats house over 200,000 people in spaces smaller than parking spots. These “coffin homes” represent the extreme end of housing inequality, where families pay premium rents for substandard conditions. Children do homework in bunk beds while parents cook on hot plates in hallways.

    Social segregation increased as neighborhoods sorted by income. Wealthy districts like the Peak and Repulse Bay became increasingly exclusive. Working-class areas like Sham Shui Po concentrated poverty and limited opportunities. This geographic sorting reduced cross-class interaction and understanding.

    Where things stand today

    Recent government initiatives show renewed attention to inequality. The 2021 Policy Address included increased public housing targets, expanded elderly care, and enhanced retraining programs. Whether these measures will meaningfully reduce inequality remains uncertain.

    The 2019 protests highlighted deep frustration with economic conditions, particularly among young people. Housing affordability, job prospects, and social mobility emerged as key grievances alongside political demands. Any sustainable political settlement must address these economic foundations.

    COVID-19 recovery presents both challenges and opportunities. Remote work could reduce geographic barriers to employment. Automation might eliminate low-wage jobs but could also create new opportunities. How policy shapes these transitions will determine whether inequality narrows or widens further.

    Making sense of three decades of data

    Income inequality in Hong Kong reflects choices about economic structure, land policy, taxation, and social investment. The trend over three decades shows consistent widening of the wealth gap, driven by forces both global and local. While some interventions have helped at the margins, no comprehensive strategy has emerged to fundamentally alter the trajectory.

    Understanding these patterns matters for anyone interested in Hong Kong’s future. The data shows that high inequality isn’t inevitable but results from specific policy choices and economic structures. Different choices could produce different outcomes. The question is whether political will exists to implement meaningful reforms, or whether the current trajectory will continue, with all its social and economic consequences.

    The numbers tell a clear story: Hong Kong’s wealth gap has grown substantially since 1991, creating a city of stark contrasts. Addressing this challenge requires acknowledging the data, understanding the drivers, and committing to structural changes that create more broadly shared prosperity.

  • 7 Critical Indicators That Define Poverty in Hong Kong Beyond Income Levels

    Measuring poverty by income alone paints an incomplete picture. In Hong Kong, where living costs rank among the world’s highest and inequality continues to widen, understanding who struggles requires a multidimensional approach. The city’s official poverty line captures one aspect of hardship, but real deprivation shows up in housing quality, educational access, health outcomes, and social participation.

    Key Takeaway

    Hong Kong uses seven poverty indicators beyond income to measure deprivation: housing conditions, educational attainment, employment quality, health access, digital connectivity, food security, and social inclusion. These metrics reveal that 1.4 million residents face poverty when measured multidimensionally, compared to income measures alone. Understanding these indicators helps policymakers design targeted interventions that address root causes rather than symptoms.

    Why income alone misses the full story

    Traditional poverty measurement focuses on median household income thresholds. Hong Kong’s official poverty line sits at 50% of median monthly household income before policy intervention. A four-person household falls below this line when earning less than HK$20,800 monthly.

    But income tells only part of the story.

    Two families earning identical wages can experience vastly different living standards. One might live in subdivided units with poor ventilation. The other might access public housing with adequate space. One child might attend well-resourced schools. Another might lack internet access for homework.

    These differences matter enormously for wellbeing and opportunity.

    The Social Development Index tracks multiple dimensions because poverty manifests through interconnected deprivations. Someone might earn above the poverty line yet struggle with chronic illness, inadequate housing, or social isolation. Each factor compounds the others.

    Housing conditions as a poverty marker

    Housing quality serves as one of the most visible poverty indicators Hong Kong residents face daily.

    Subdivided units, cage homes, and rooftop structures house over 220,000 people. These spaces average 48 square feet per person, less than half a standard parking space. Families cook, sleep, study, and live in single rooms without proper ventilation or natural light.

    The health implications run deep:

    • Respiratory infections spread rapidly in cramped quarters
    • Mental health deteriorates without private space
    • Children lack quiet areas for studying
    • Elderly residents face mobility hazards

    Housing costs consume disproportionate shares of low-income budgets. Families earning HK$10,000 monthly often spend HK$4,000 to HK$5,000 on rent alone. This leaves minimal resources for food, healthcare, or education.

    Public housing waitlists stretch beyond six years for general applicants. During this waiting period, families cycle through temporary arrangements that destabilize employment, schooling, and social networks.

    Housing is not just shelter. It determines health outcomes, educational achievement, employment stability, and social participation. Measuring poverty without assessing housing conditions ignores a fundamental dimension of wellbeing.

    Educational access and attainment gaps

    Educational inequality perpetuates poverty across generations. While Hong Kong provides free primary and secondary education, significant disparities emerge in educational quality and support.

    Students from low-income families face multiple barriers:

    1. Limited access to tutorial services that middle-class peers use routinely
    2. Inadequate study space at home due to housing constraints
    3. Inability to afford extracurricular activities that build skills
    4. Digital divides that became critical during remote learning periods
    5. Nutritional deficits that affect concentration and attendance

    Secondary school completion rates vary dramatically by income quartile. Among the poorest 20% of households, only 68% of young adults complete secondary education, compared to 94% from the wealthiest quintile.

    Tertiary education remains financially prohibitive despite loan programs. Students from disadvantaged backgrounds graduate with larger debt burdens and often work part-time during studies, reducing academic performance and networking opportunities.

    The intergenerational impact compounds over time. Parents with limited education face employment barriers, creating household stress that affects children’s academic outcomes, perpetuating the cycle.

    Employment quality beyond wage levels

    Having a job does not guarantee escape from poverty. Employment quality matters as much as employment status.

    Hong Kong’s working poor population exceeds 500,000 people. These individuals hold jobs yet earn insufficient income to meet basic needs. Many work in sectors characterized by:

    • Irregular hours without guaranteed minimum shifts
    • No paid sick leave or annual leave
    • Limited workplace safety protections
    • Few opportunities for skill development or advancement
    • Vulnerability to sudden termination without cause

    The gig economy has expanded precarious work arrangements. Delivery drivers, cleaners, security guards, and retail workers often piece together multiple part-time positions without benefits or job security.

    Employment Type Average Monthly Income Job Security Benefits Coverage
    Permanent full-time HK$18,500 High Comprehensive
    Contract position HK$14,200 Medium Partial
    Part-time multiple jobs HK$9,800 Low Minimal
    Gig/platform work HK$8,400 Very low None

    Underemployment affects poverty as severely as unemployment. Workers with skills and qualifications who can only find low-wage positions experience income poverty plus the psychological toll of underutilization.

    Health access and outcomes

    Healthcare accessibility reveals another critical poverty dimension. Hong Kong’s public healthcare system provides subsidized services, yet significant barriers prevent equal access.

    Wait times for specialist consultations in public hospitals can extend 18 to 24 months for non-urgent conditions. During this period, conditions worsen, productivity declines, and quality of life deteriorates.

    Low-income residents often delay seeking care due to:

    • Transportation costs to medical facilities
    • Lost wages from taking time off work
    • Inability to afford prescribed medications not covered by subsidies
    • Lack of health literacy to navigate the system effectively

    Chronic disease prevalence correlates strongly with income levels. Diabetes, hypertension, and cardiovascular conditions occur at higher rates among lower-income populations, partly due to diet, stress, and environmental factors.

    Mental health services remain particularly inaccessible. Public psychiatric services face overwhelming demand while private counseling costs HK$800 to HK$1,500 per session, prohibitive for most low-income individuals.

    The health-poverty connection runs both directions. Poor health limits employment opportunities and earning capacity. Low income restricts health-promoting resources like nutritious food, safe housing, and preventive care.

    Digital connectivity and information access

    The digital divide emerged as a stark poverty indicator during the COVID-19 pandemic. When schools shifted online, students without computers or stable internet faced immediate educational disadvantage.

    But digital exclusion predated and extends beyond pandemic disruptions.

    Approximately 180,000 Hong Kong households lack home internet access. Another 250,000 rely solely on mobile data plans with limited capacity. For students, job seekers, and workers, this creates cascading disadvantages:

    • Students cannot complete assignments requiring research or typing
    • Job seekers miss online-only application opportunities
    • Workers cannot access training programs or remote work options
    • Families pay more for goods and services unavailable at online discounts

    Government services increasingly move online, from housing applications to tax filing to benefit enrollment. Those without digital access face longer processing times, missed deadlines, and reduced service quality.

    The cost barrier remains significant. A basic home internet plan costs HK$120 to HK$180 monthly, representing 5% to 8% of income for families at the poverty line. Computers or tablets add upfront costs of HK$3,000 to HK$8,000.

    Digital literacy compounds access issues. Older residents and recent immigrants may have internet access but lack skills to use online services effectively, creating functional exclusion despite technical connectivity.

    Food security and nutritional adequacy

    Food insecurity affects approximately 400,000 Hong Kong residents who regularly skip meals, reduce portion sizes, or rely on the cheapest, least nutritious options.

    The manifestations vary:

    • Families eating rice with soy sauce as complete meals
    • Children arriving at school without breakfast
    • Elderly residents choosing between medication and food
    • Parents feeding children while going hungry themselves

    Food prices in Hong Kong rank among the highest globally. A basic nutritious diet costs approximately HK$50 per person daily, totaling HK$6,000 monthly for a family of four. This represents 60% of income for households at the poverty line.

    Food assistance programs provide critical support but cannot meet full demand. Food banks report turning away applicants due to supply limitations. School lunch subsidies help but do not cover dinners, weekends, or school holidays.

    Nutritional quality suffers most. Fresh vegetables, fruits, and protein sources cost significantly more than instant noodles, white rice, and processed foods. Low-income families consume diets high in refined carbohydrates and sodium but deficient in vitamins, minerals, and protein.

    The health consequences appear in higher rates of anemia, stunted growth in children, and diet-related chronic diseases. These health impacts then create additional economic burdens, perpetuating poverty.

    Social participation and inclusion

    Social exclusion represents perhaps the least visible yet most damaging poverty dimension. Inability to participate in normal social activities isolates individuals and limits opportunities.

    Children from low-income families often cannot:

    • Join school trips requiring fees
    • Participate in sports requiring equipment or uniforms
    • Attend classmates’ birthday celebrations with appropriate gifts
    • Engage in extracurricular activities that build friendships

    This exclusion affects self-esteem, peer relationships, and social skill development. Children internalize shame about their circumstances, affecting mental health and academic motivation.

    Adults face similar barriers. Social gatherings often involve expenses for meals, transportation, or activities that low-income individuals cannot afford. Over time, invitations decrease and social networks shrink.

    Community participation requires resources. Volunteering opportunities may require transportation costs. Civic engagement meetings occur during work hours. Cultural events charge admission fees.

    The psychological impact of social exclusion compounds material deprivation. Isolation increases depression and anxiety rates. Reduced social networks limit access to job information, mutual support, and collective advocacy.

    Measuring poverty comprehensively

    The seven poverty indicators Hong Kong uses create a multidimensional picture that income alone cannot capture. Researchers and policymakers increasingly recognize that deprivation manifests through interconnected disadvantages.

    Someone experiencing three or more of these indicators faces severe multidimensional poverty:

    1. Housing inadequacy (overcrowding, poor conditions, unaffordable rent)
    2. Educational barriers (incomplete schooling, lack of learning resources)
    3. Employment precarity (unstable work, insufficient income, no benefits)
    4. Health access limitations (delayed care, untreated conditions, poor outcomes)
    5. Digital exclusion (no internet access, inadequate devices, low literacy)
    6. Food insecurity (insufficient quantity, poor quality, skipped meals)
    7. Social isolation (inability to participate, limited networks, exclusion)

    Data shows that 42% of income-poor households also experience at least two additional deprivations. This overlap demonstrates how disadvantages cluster and reinforce each other.

    The multidimensional approach also identifies vulnerabilities among those above the income poverty line. Approximately 300,000 Hong Kong residents earn sufficient income yet face severe deprivation in housing, health, or social inclusion.

    Policy implications and intervention design

    Understanding poverty through multiple indicators transforms how interventions get designed and evaluated.

    Income transfers alone cannot address housing quality, educational gaps, or social exclusion. Effective poverty reduction requires coordinated approaches:

    • Housing policy that prioritizes affordability and adequate living standards
    • Educational support that includes tutoring, meals, and extracurricular access
    • Employment programs that emphasize job quality and worker protections
    • Healthcare expansion that reduces wait times and covers essential services
    • Digital inclusion initiatives providing devices, connectivity, and training
    • Food security programs ensuring nutritional adequacy, not just calories
    • Community development that builds social capital and participation opportunities

    Evaluation metrics must track changes across all dimensions. A policy that raises incomes but worsens housing stress or reduces social participation may not improve overall wellbeing.

    The interconnected nature of poverty indicators suggests that interventions addressing multiple dimensions simultaneously create synergistic benefits. For example, improved housing quality enhances health outcomes, educational achievement, and employment stability.

    Data collection and monitoring challenges

    Tracking multidimensional poverty requires robust data systems that many jurisdictions lack. Hong Kong faces several measurement challenges:

    • Inconsistent data collection across different government departments
    • Privacy concerns limiting data sharing and integration
    • Lag times between data collection and policy application
    • Difficulty capturing informal or hidden populations
    • Subjective elements in measuring social exclusion or wellbeing

    The Social Development Index addresses some gaps by compiling indicators from multiple sources. However, comprehensive poverty monitoring requires sustained investment in data infrastructure and interdepartmental coordination.

    Longitudinal data proves particularly valuable. Tracking individuals and families over time reveals poverty dynamics: who exits poverty, who falls into it, and what factors drive these transitions. This information guides prevention and intervention timing.

    Community-based participatory research complements official statistics. People experiencing poverty provide insights that administrative data cannot capture about daily challenges, coping strategies, and intervention effectiveness.

    Moving beyond income-focused solutions

    The evidence is clear. Poverty in Hong Kong extends far beyond insufficient income. Housing conditions, educational access, employment quality, health outcomes, digital connectivity, food security, and social inclusion all define whether people can meet basic needs and participate fully in society.

    Policymakers, researchers, and practitioners increasingly recognize that effective poverty reduction requires multidimensional strategies. Income support remains important but insufficient without addressing the structural factors that create and perpetuate deprivation.

    For academic researchers, these seven indicators provide frameworks for investigating poverty dynamics and evaluating interventions. For policy analysts, they offer metrics for assessing program effectiveness across multiple wellbeing dimensions. For social workers and NGO professionals, they highlight the interconnected challenges clients face and the need for holistic support.

    Understanding poverty through multiple lenses does not just improve measurement accuracy. It fundamentally changes how we think about solutions, moving from narrow income transfers toward comprehensive approaches that address root causes and build genuine opportunity for all Hong Kong residents.

  • Understanding the Working Poor: Employment Statistics That Challenge Common Assumptions

    Millions of people clock in every day, work full shifts, and still struggle to afford basic needs. The working poor are not a small group. They are not lazy. They are not unemployed. They hold jobs, sometimes multiple jobs, and yet poverty defines their daily reality.

    Key Takeaway

    Working poor statistics reveal that employment alone does not guarantee financial security. Across Hong Kong and globally, millions of workers earn wages too low to escape poverty. Understanding these data patterns helps researchers, journalists, and advocates challenge stereotypes, identify vulnerable groups, and push for policies that address wage stagnation, underemployment, and structural inequality affecting low-income workers.

    Who counts as working poor

    Defining the working poor matters because it shapes how we measure the problem and design solutions.

    Most definitions focus on people who spend at least half the year in the labor force but still live below the poverty line. That means working or actively looking for work for 27 weeks or more, yet earning income insufficient to meet basic needs.

    Some frameworks use relative poverty thresholds. A household earning less than 50% of the median income qualifies as poor, regardless of employment status. When workers fall into this category, they become part of the working poor.

    Other measures emphasize expenditure. If a household spends more than 60% of income on housing, food, and transport, financial stress becomes chronic. Employment does not shield them from hardship.

    Age, family size, and regional cost of living all influence these calculations. A single worker in a rural area faces different poverty risks than a parent of three in an expensive city.

    Numbers that challenge common beliefs

    Statistics often contradict what people assume about poverty and work.

    In Hong Kong, nearly one in five employed individuals lives in poverty. That translates to hundreds of thousands of workers who cannot afford stable housing, healthcare, or education for their children despite holding jobs.

    Full-time employment does not eliminate poverty risk. Data shows that many working poor hold full-time positions. They are not underemployed by hours. They are underpaid by wage.

    Women face higher rates of working poverty than men. Gender wage gaps, occupational segregation, and caregiving responsibilities all contribute. Women cluster in lower-paid sectors like retail, hospitality, and domestic work.

    Young workers and older workers both experience elevated poverty rates. Youth enter the labor market with limited bargaining power and few skills. Older workers face age discrimination and limited retraining opportunities.

    Education does not guarantee escape. While higher education correlates with better wages, many degree holders still earn poverty-level incomes. Credential inflation and mismatched skills reduce the protective effect of schooling.

    Industries where working poverty clusters

    Certain sectors concentrate low-wage workers at much higher rates than others.

    Sector Poverty risk factors Typical wage range
    Retail and sales Part-time hours, commission-based pay, limited benefits Below median
    Food service Irregular shifts, tip dependency, high turnover Lowest quartile
    Cleaning and maintenance Contract work, no job security, minimal advancement Below median
    Security services Long hours, low hourly rates, limited training Below median
    Elderly care Emotional labor, physical demands, undervaluation Below median

    Retail workers often face unpredictable schedules. Employers adjust hours week by week, making budgeting nearly impossible. Workers cannot plan childcare, education, or second jobs.

    Food service relies heavily on tips and variable shifts. Base wages sit at legal minimums. Tips fluctuate with seasons, economic conditions, and customer demographics.

    Cleaning and maintenance jobs frequently operate through subcontractors. Workers lack direct employment relationships with the organizations they serve. Benefits disappear. Job security evaporates.

    Security guards work long shifts but earn low hourly wages. Overnight premiums rarely compensate for the health costs of disrupted sleep and social isolation.

    Elderly care workers provide essential services yet receive minimal pay. Society undervalues care work, especially when performed by women or migrants.

    Household composition and poverty dynamics

    Family structure shapes poverty risk in powerful ways.

    Single-parent households face the highest working poverty rates. One income supports multiple people. Childcare costs consume large portions of earnings. Time constraints limit overtime and second jobs.

    Multi-generational households sometimes buffer poverty through shared expenses. Grandparents provide childcare. Adult children contribute income. But overcrowding and stress often accompany these arrangements.

    Dual-income households are not immune. When both partners earn low wages, combined income still falls short. Childcare, transport, and work-related expenses reduce net income significantly.

    Households with disabled members experience compounded challenges. Caregiving reduces available work hours. Medical expenses drain savings. Accessible housing costs more.

    Migrant workers often send remittances home, reducing their own consumption. They live in shared accommodation, skip meals, and forgo healthcare to support families abroad.

    Geographic patterns in working poverty

    Location determines opportunity and cost.

    Urban centers offer more jobs but charge higher rents. Workers spend hours commuting from affordable neighborhoods to job centers. Transport costs eat into wages.

    Rural areas provide cheaper housing but fewer employment options. Jobs cluster in agriculture, tourism, or resource extraction. Wages lag behind urban rates. Services like healthcare and education require travel.

    Suburban districts trap workers between high costs and limited transit. Car ownership becomes necessary but expensive. Insurance, fuel, and maintenance add up.

    Public housing availability varies dramatically by region. Long waiting lists mean workers spend years in private rentals, paying market rates on poverty wages.

    Proximity to family networks matters. Workers near relatives access informal childcare, meal sharing, and emergency support. Those far from kin face isolation and higher costs.

    Policy interventions that move the needle

    Evidence shows which approaches actually reduce working poverty.

    1. Minimum wage increases tied to cost of living indices prevent erosion of purchasing power over time.
    2. Earned income tax credits supplement low wages without discouraging employment.
    3. Affordable childcare subsidies enable parents to work more hours and accept better jobs.
    4. Public transport subsidies reduce the effective cost of commuting for low-wage workers.
    5. Skills training programs with employer partnerships create pathways to higher-paying roles.

    Minimum wage laws work best when adjusted regularly. Static rates lose value to inflation. Workers fall behind even while working the same hours.

    Tax credits deliver income support without creating welfare traps. Workers keep more of what they earn. Benefits phase out gradually as income rises.

    Childcare costs often exceed rent for families with young children. Subsidized care removes a major barrier to employment and advancement.

    Transport subsidies matter most in sprawling cities. Workers can accept jobs farther from home without losing income to fares.

    Training programs succeed when tied to actual hiring. Partnerships with employers ensure skills match demand. Credentials lead to real job offers.

    Effective anti-poverty policy recognizes that work alone does not solve poverty. Wages must cover basic needs. Support systems must fill gaps. Opportunity must be accessible to all workers, regardless of sector or background.

    Data gaps and measurement challenges

    Current statistics undercount and misrepresent working poverty in several ways.

    Informal work escapes official counts. Gig workers, cash-paid laborers, and undocumented workers rarely appear in surveys. Their poverty remains invisible to policymakers.

    Self-employment complicates income measurement. Earnings fluctuate. Expenses blur the line between business and personal costs. Poverty status changes month to month.

    In-kind benefits and informal support do not show up in income data. Households receiving free childcare from relatives or meals from community programs have higher effective income than statistics suggest.

    Asset poverty differs from income poverty. Workers with low wages but family wealth face different constraints than those without any safety net.

    Temporary poverty spells versus chronic poverty require different responses. Workers who experience brief poverty after job loss need different support than those stuck in low-wage careers for decades.

    Breaking stereotypes through data

    Numbers correct harmful misconceptions about the working poor.

    • Most working poor are not teenagers earning pocket money. They are adults supporting families.
    • Working poverty affects citizens and long-term residents, not just recent immigrants.
    • Education and effort do not guarantee escape when wages stagnate and costs rise.
    • Full-time work does not prevent poverty when hourly rates fall below living wage thresholds.
    • Working poor households often include multiple earners, not single unemployed adults.

    Media narratives often blame individuals for poverty. Statistics reveal structural causes. Wage floors matter more than work ethic. Housing policy shapes outcomes more than personal choices.

    Stereotypes about laziness crumble when data shows working poor logging more hours than higher-income workers. Many hold multiple jobs. They work nights, weekends, and holidays.

    Assumptions about immigration distort reality. Native-born workers experience working poverty at significant rates. The problem crosses citizenship lines.

    Beliefs that education solves everything ignore credential inflation and sector-specific wage ceilings. Degrees help but do not guarantee middle-class incomes.

    Historical data reveals how working poverty evolves with economic shifts.

    The 1990s saw working poverty decline in many developed economies. Strong growth, tight labor markets, and rising minimum wages lifted incomes.

    The 2008 financial crisis reversed progress. Job losses, wage cuts, and austerity measures pushed more workers into poverty. Recovery took years and bypassed many low-wage sectors.

    Automation and globalization changed the composition of working poverty. Manufacturing jobs disappeared. Service sector jobs expanded but paid less. Middle-skill jobs hollowed out.

    The COVID-19 pandemic exposed and worsened working poverty. Essential workers faced health risks without hazard pay. Service workers lost jobs entirely. Recovery remains uneven.

    Recent inflation surges eroded real wages. Workers saw paychecks grow nominally but shrink in purchasing power. Rent, food, and energy costs outpaced wage increases.

    Comparing Hong Kong to global patterns

    Hong Kong’s working poverty statistics reflect both unique local factors and broader global trends.

    High housing costs distinguish Hong Kong from most other cities. Rent consumes a larger share of income than almost anywhere else. Workers earning median wages still struggle with housing.

    Strong social safety nets in Nordic countries keep working poverty rates low. Universal childcare, healthcare, and education reduce the income needed to avoid poverty.

    The United States shows high working poverty despite high GDP per capita. Weak labor protections, expensive healthcare, and limited social programs leave many workers vulnerable.

    East Asian economies share some patterns with Hong Kong. Rapid development, income inequality, and limited welfare states create similar challenges.

    Latin American countries often have higher informal employment rates. Working poverty statistics undercount the true scale because so many workers operate outside formal systems.

    Using statistics for advocacy and policy change

    Data becomes powerful when translated into action.

    Researchers can identify which worker groups face highest risk. Targeted interventions reach those who need help most.

    Journalists can use statistics to humanize abstract policy debates. Numbers paired with personal stories create compelling narratives.

    Advocates can counter false claims with evidence. When opponents blame individuals, data reveals structural causes.

    Policymakers can track intervention effectiveness. Statistics show whether programs reduce poverty or waste resources.

    Students can build research projects around working poverty data. Fresh analysis generates new insights and career opportunities.

    Making sense of the numbers

    Working poor statistics challenge the myth that employment guarantees security. Millions of people work hard, follow rules, and still cannot afford basic dignity.

    The data points to clear solutions. Raise wage floors. Reduce housing costs. Subsidize childcare and transport. Invest in skills that lead to real jobs.

    Understanding these statistics helps everyone see poverty as a policy choice, not an individual failure. When we measure the problem accurately, we can solve it effectively.