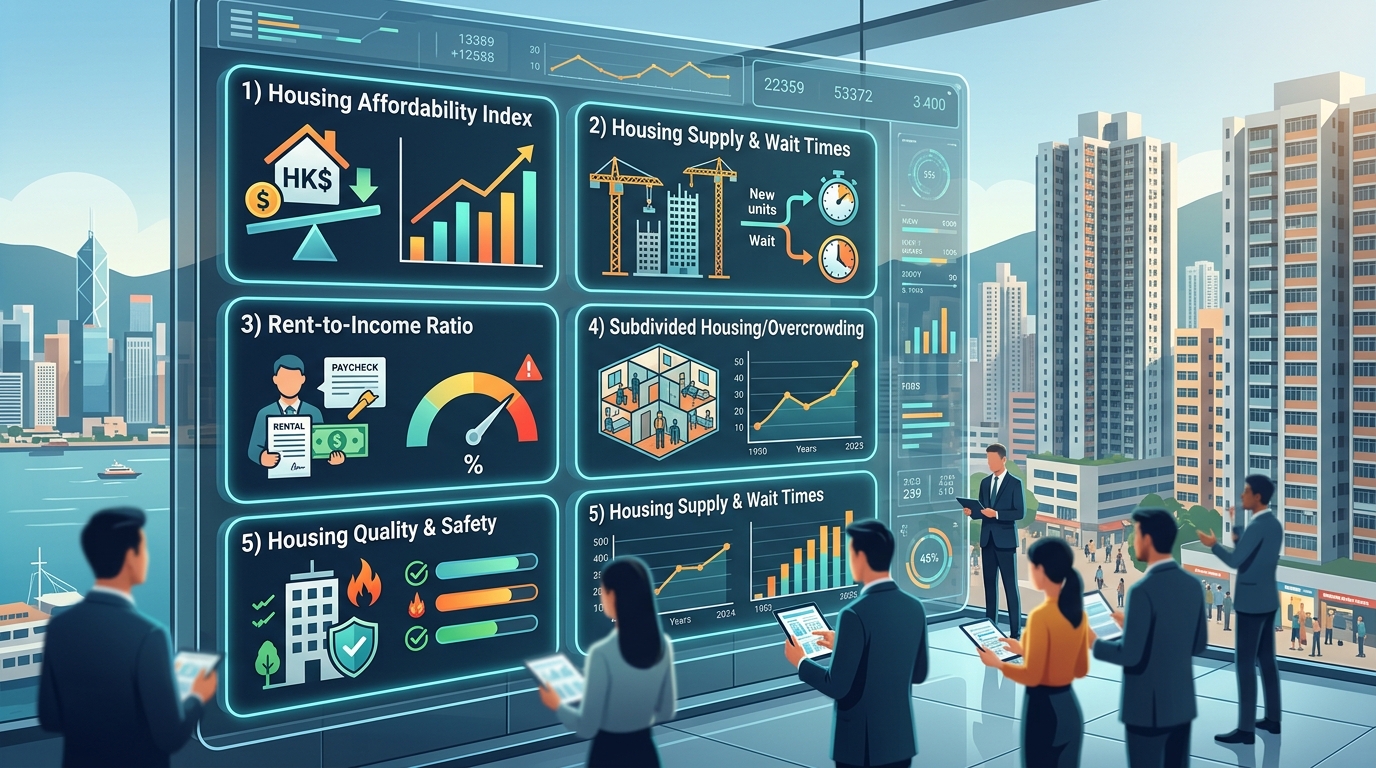

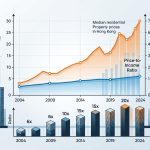


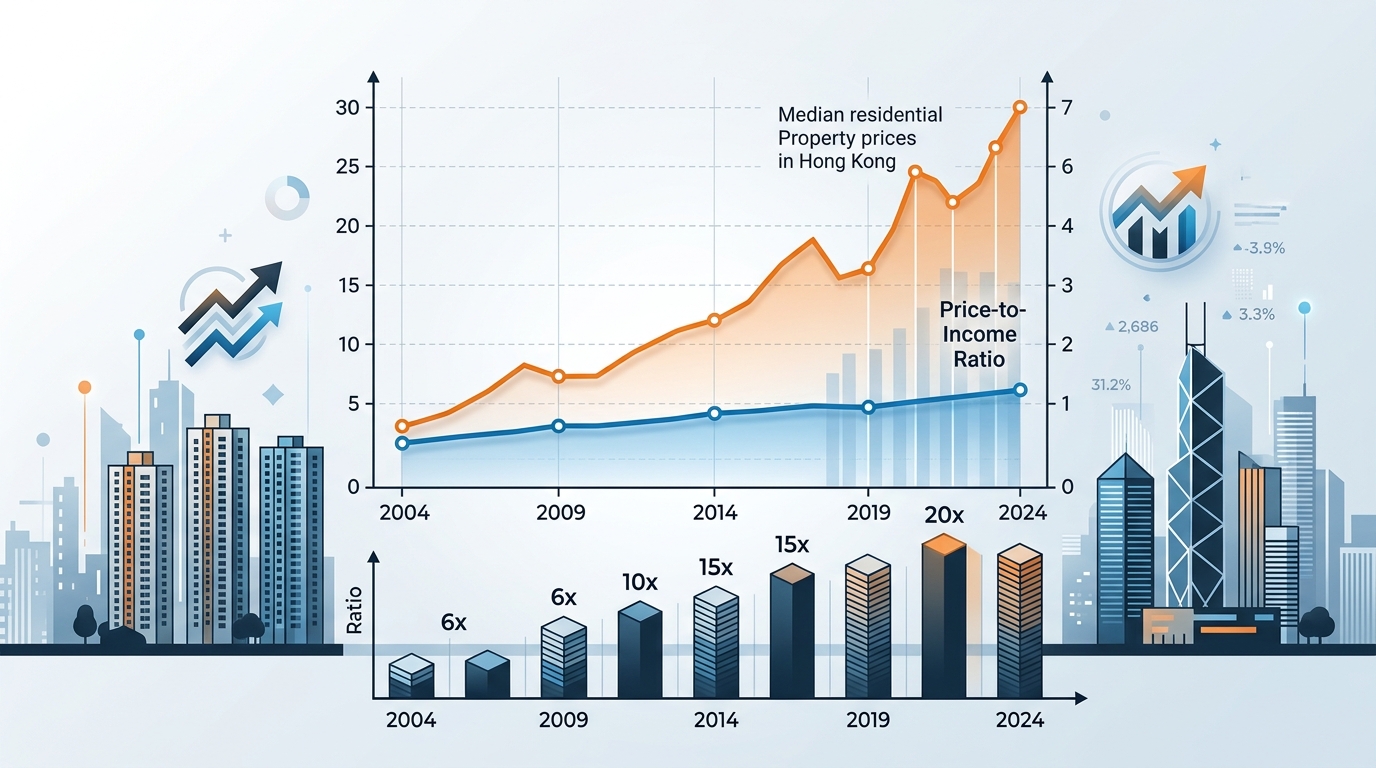
The True Cost of Homeownership: Tracking Property Price-to-Income Ratios Over Two Decades
Housing affordability isn't just about sticker prices. A property listed at HK$8 million might seem…
Special Educational Needs Support: Tracking Resource Allocation and Student Outcomes Over Time
Managing budgets for special education programs means keeping track of dozens of moving parts at…
How Subdivided Flats Are Reshaping Hong Kong’s Urban Landscape
Over 220,000 people in Hong Kong call subdivided flats home. These cramped living spaces, carved…

The Digital Divide in Hong Kong Classrooms: Technology Access and Learning Inequality
Hong Kong's reputation as a global tech hub masks a troubling reality. Thousands of students…
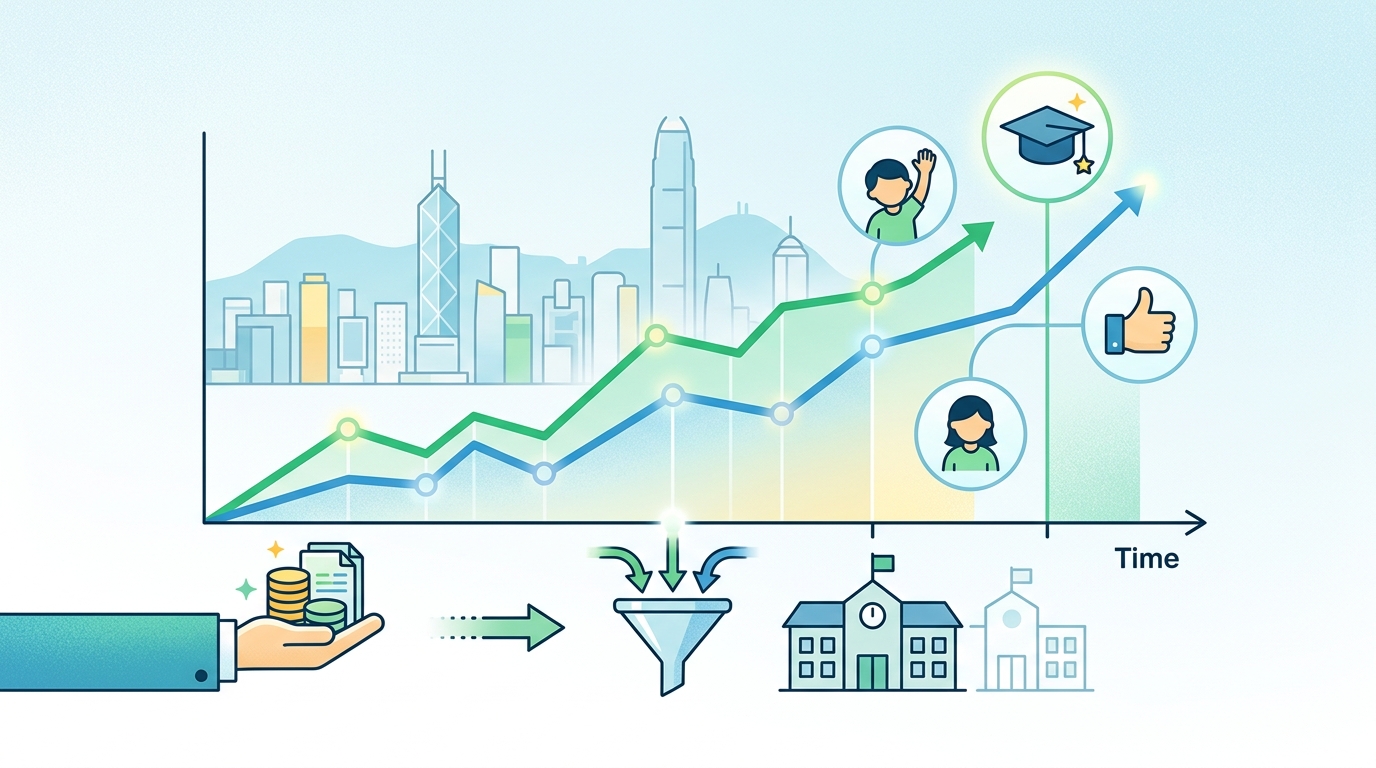
Does Early Childhood Education Investment Pay Off? Evidence from Hong Kong Data
Investing in early childhood education often feels like a leap of faith. Policymakers allocate budgets,…
University Enrollment Patterns: Who Gets Left Behind in Hong Kong’s Higher Education System
Higher education in Hong Kong has become increasingly competitive over the past two decades. Thousands…

Teacher Shortage Trends: Mapping Hong Kong’s Educator Supply and Demand Since 2000
The past two decades have reshaped Hong Kong's education landscape in ways few anticipated. Classrooms…

The Rising Cost of Private Tutoring: What the Data Tells Us About Hong Kong Families
Parents across Hong Kong face a familiar dilemma every school year. Should they invest in…

Are Hong Kong Students Experiencing More Academic Stress? A Longitudinal Study
Hong Kong's students consistently rank among the highest performers in international assessments, but this achievement…