


Analyzing the Impact of Automation on Poverty Levels in Hong Kong in 2026
Hong Kong stands at a pivotal moment in its social and economic evolution. As automation…

Evaluating the Impact of Digital Financial Access on Poverty Reduction in Hong Kong in 2026
Hong Kong's skyline is iconic, but beneath its glittering surface lies an ongoing challenge: reducing…

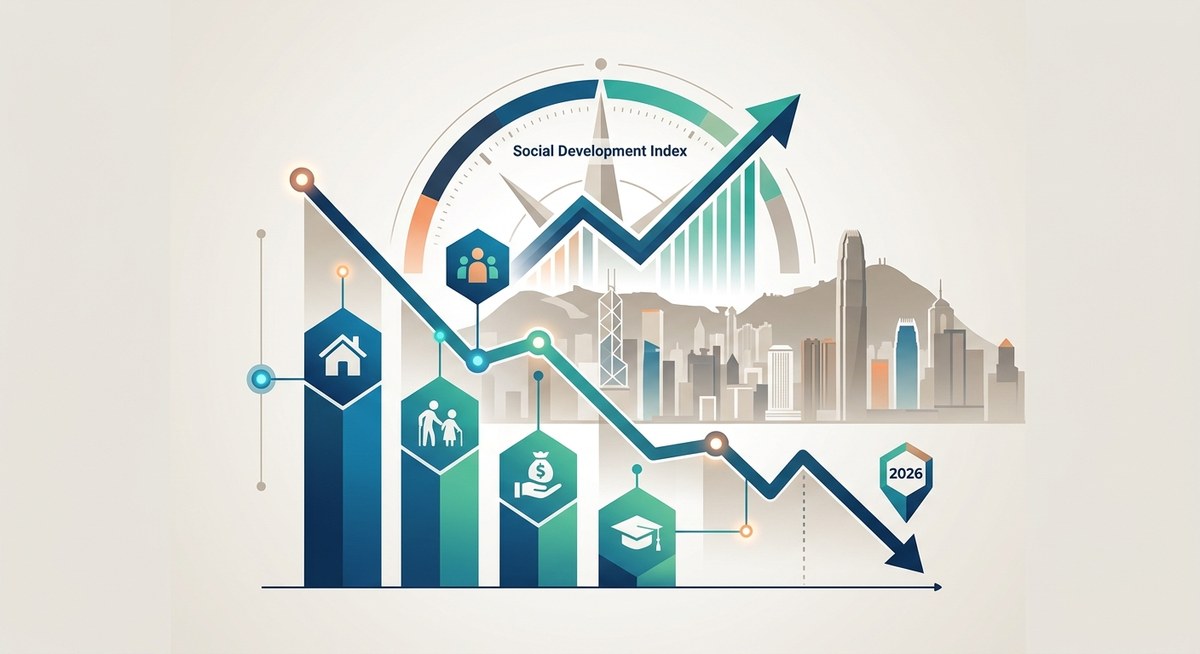
How Hong Kong’s Poverty Rate Is Changing in 2026 and What It Means for Social Policy
Hong Kong's social fabric is complex and layered. In 2026, the city’s poverty rate continues…
How Hong Kong’s Social Welfare Policies Influence Poverty Trends in 2026
Hong Kong's social fabric continues to evolve amid rapid economic shifts and demographic changes. As…

Evaluating the Effectiveness of Social Welfare Programs in Reducing Poverty in Hong Kong
Hong Kong faces persistent challenges with income inequality and affordable housing. Despite its reputation as…

Assessing the Impact of Financial Inclusion Initiatives on Poverty Reduction in Hong Kong
Financial inclusion plays a crucial role in shaping a fairer, more resilient Hong Kong. As…

Top 10 Economic Indicators Revealing Hong Kong’s Poverty Dynamics
Hong Kong is often celebrated for its vibrant economy and dazzling skyline. Yet beneath the…

How Social Mobility Has Changed in Hong Kong Over the Last Two Decades
Social mobility in Hong Kong has undergone significant shifts over the past twenty years. For…

Analyzing the Impact of Housing Costs on Poverty Levels in Hong Kong
Housing costs in Hong Kong have long been a concern for residents, policymakers, and social…