Measuring poverty by income alone paints an incomplete picture. In Hong Kong, where living costs rank among the world’s highest and inequality continues to widen, understanding who struggles requires a multidimensional approach. The city’s official poverty line captures one aspect of hardship, but real deprivation shows up in housing quality, educational access, health outcomes, and social participation.
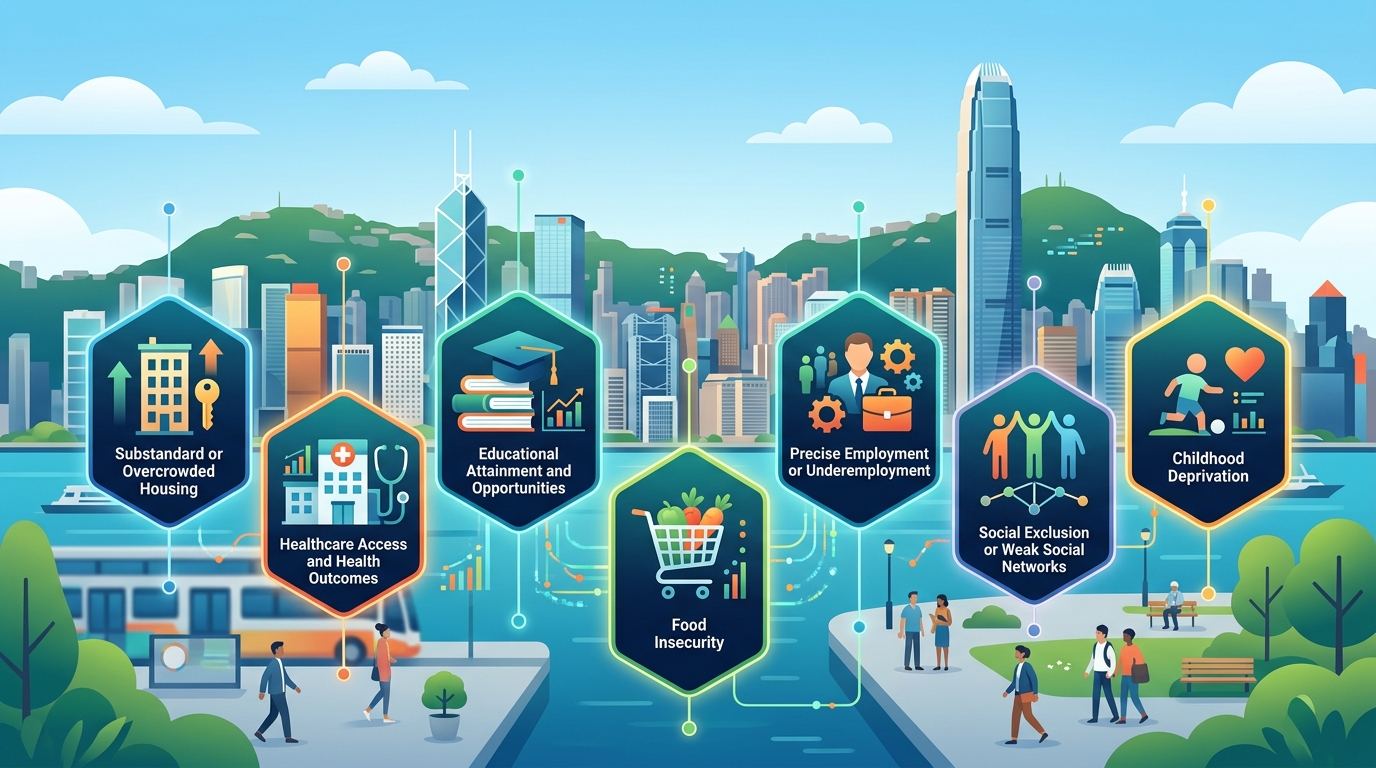
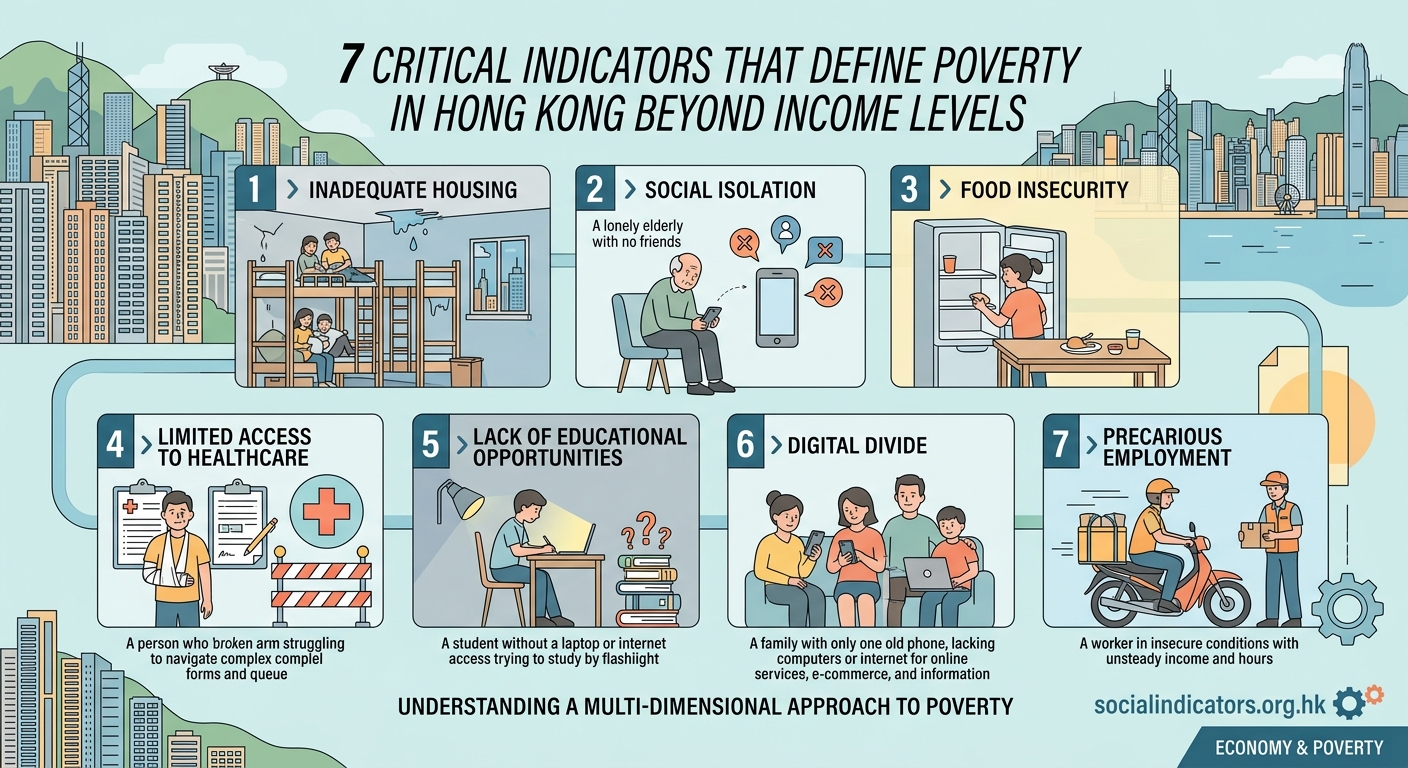
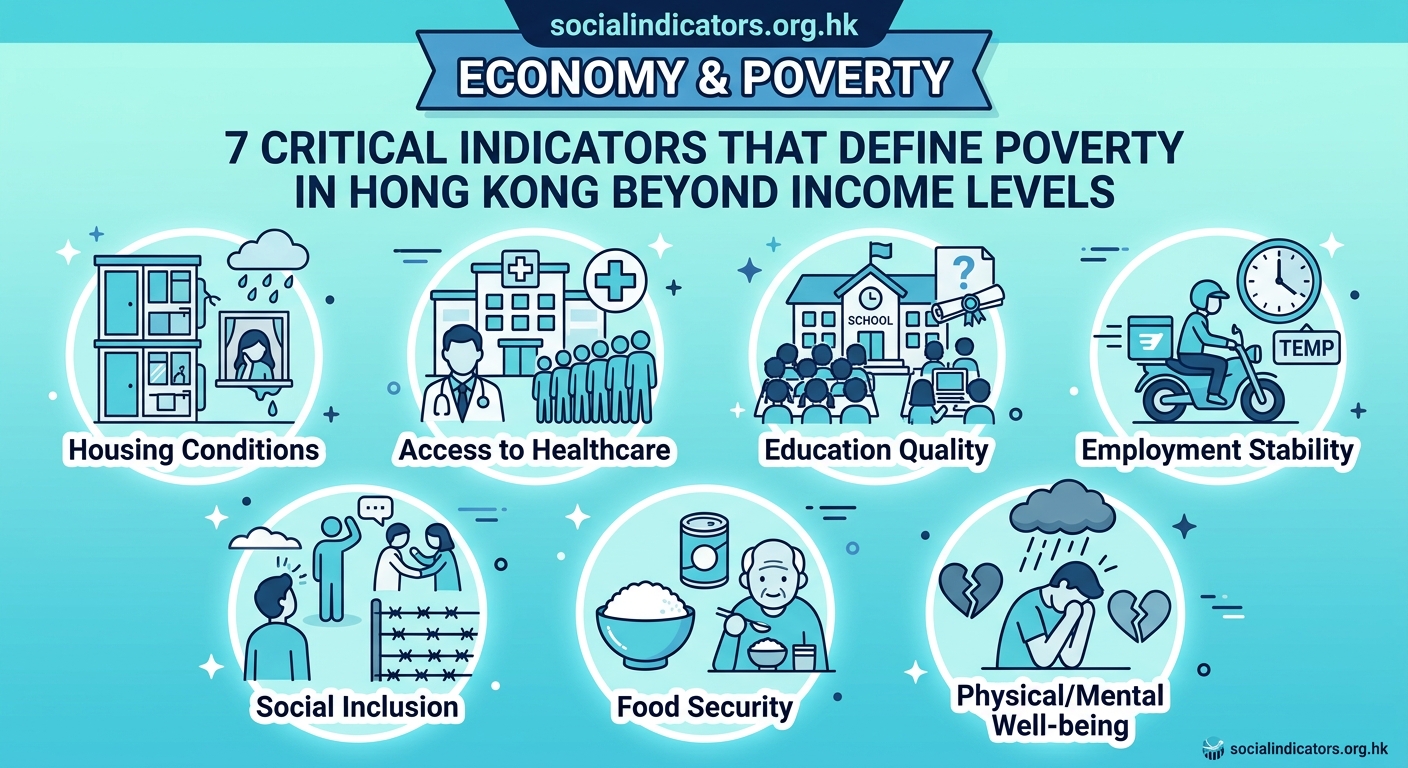
Hong Kong uses seven poverty indicators beyond income to measure deprivation: housing conditions, educational attainment, employment quality, health access, digital connectivity, food security, and social inclusion. These metrics reveal that 1.4 million residents face poverty when measured multidimensionally, compared to income measures alone. Understanding these indicators helps policymakers design targeted interventions that address root causes rather than symptoms.
Why income alone misses the full story
Traditional poverty measurement focuses on median household income thresholds. Hong Kong’s official poverty line sits at 50% of median monthly household income before policy intervention. A four-person household falls below this line when earning less than HK$20,800 monthly.
But income tells only part of the story.
Two families earning identical wages can experience vastly different living standards. One might live in subdivided units with poor ventilation. The other might access public housing with adequate space. One child might attend well-resourced schools. Another might lack internet access for homework.
These differences matter enormously for wellbeing and opportunity.
The Social Development Index tracks multiple dimensions because poverty manifests through interconnected deprivations. Someone might earn above the poverty line yet struggle with chronic illness, inadequate housing, or social isolation. Each factor compounds the others.
Housing conditions as a poverty marker
Housing quality serves as one of the most visible poverty indicators Hong Kong residents face daily.
Subdivided units, cage homes, and rooftop structures house over 220,000 people. These spaces average 48 square feet per person, less than half a standard parking space. Families cook, sleep, study, and live in single rooms without proper ventilation or natural light.
The health implications run deep:
- Respiratory infections spread rapidly in cramped quarters
- Mental health deteriorates without private space
- Children lack quiet areas for studying
- Elderly residents face mobility hazards
Housing costs consume disproportionate shares of low-income budgets. Families earning HK$10,000 monthly often spend HK$4,000 to HK$5,000 on rent alone. This leaves minimal resources for food, healthcare, or education.
Public housing waitlists stretch beyond six years for general applicants. During this waiting period, families cycle through temporary arrangements that destabilize employment, schooling, and social networks.
Housing is not just shelter. It determines health outcomes, educational achievement, employment stability, and social participation. Measuring poverty without assessing housing conditions ignores a fundamental dimension of wellbeing.
Educational access and attainment gaps
Educational inequality perpetuates poverty across generations. While Hong Kong provides free primary and secondary education, significant disparities emerge in educational quality and support.
Students from low-income families face multiple barriers:
- Limited access to tutorial services that middle-class peers use routinely
- Inadequate study space at home due to housing constraints
- Inability to afford extracurricular activities that build skills
- Digital divides that became critical during remote learning periods
- Nutritional deficits that affect concentration and attendance
Secondary school completion rates vary dramatically by income quartile. Among the poorest 20% of households, only 68% of young adults complete secondary education, compared to 94% from the wealthiest quintile.
Tertiary education remains financially prohibitive despite loan programs. Students from disadvantaged backgrounds graduate with larger debt burdens and often work part-time during studies, reducing academic performance and networking opportunities.
The intergenerational impact compounds over time. Parents with limited education face employment barriers, creating household stress that affects children’s academic outcomes, perpetuating the cycle.
Employment quality beyond wage levels
Having a job does not guarantee escape from poverty. Employment quality matters as much as employment status.
Hong Kong’s working poor population exceeds 500,000 people. These individuals hold jobs yet earn insufficient income to meet basic needs. Many work in sectors characterized by:
- Irregular hours without guaranteed minimum shifts
- No paid sick leave or annual leave
- Limited workplace safety protections
- Few opportunities for skill development or advancement
- Vulnerability to sudden termination without cause
The gig economy has expanded precarious work arrangements. Delivery drivers, cleaners, security guards, and retail workers often piece together multiple part-time positions without benefits or job security.
| Employment Type | Average Monthly Income | Job Security | Benefits Coverage |
|---|---|---|---|
| Permanent full-time | HK$18,500 | High | Comprehensive |
| Contract position | HK$14,200 | Medium | Partial |
| Part-time multiple jobs | HK$9,800 | Low | Minimal |
| Gig/platform work | HK$8,400 | Very low | None |
Underemployment affects poverty as severely as unemployment. Workers with skills and qualifications who can only find low-wage positions experience income poverty plus the psychological toll of underutilization.
Health access and outcomes
Healthcare accessibility reveals another critical poverty dimension. Hong Kong’s public healthcare system provides subsidized services, yet significant barriers prevent equal access.
Wait times for specialist consultations in public hospitals can extend 18 to 24 months for non-urgent conditions. During this period, conditions worsen, productivity declines, and quality of life deteriorates.
Low-income residents often delay seeking care due to:
- Transportation costs to medical facilities
- Lost wages from taking time off work
- Inability to afford prescribed medications not covered by subsidies
- Lack of health literacy to navigate the system effectively
Chronic disease prevalence correlates strongly with income levels. Diabetes, hypertension, and cardiovascular conditions occur at higher rates among lower-income populations, partly due to diet, stress, and environmental factors.
Mental health services remain particularly inaccessible. Public psychiatric services face overwhelming demand while private counseling costs HK$800 to HK$1,500 per session, prohibitive for most low-income individuals.
The health-poverty connection runs both directions. Poor health limits employment opportunities and earning capacity. Low income restricts health-promoting resources like nutritious food, safe housing, and preventive care.
Digital connectivity and information access
The digital divide emerged as a stark poverty indicator during the COVID-19 pandemic. When schools shifted online, students without computers or stable internet faced immediate educational disadvantage.
But digital exclusion predated and extends beyond pandemic disruptions.
Approximately 180,000 Hong Kong households lack home internet access. Another 250,000 rely solely on mobile data plans with limited capacity. For students, job seekers, and workers, this creates cascading disadvantages:
- Students cannot complete assignments requiring research or typing
- Job seekers miss online-only application opportunities
- Workers cannot access training programs or remote work options
- Families pay more for goods and services unavailable at online discounts
Government services increasingly move online, from housing applications to tax filing to benefit enrollment. Those without digital access face longer processing times, missed deadlines, and reduced service quality.
The cost barrier remains significant. A basic home internet plan costs HK$120 to HK$180 monthly, representing 5% to 8% of income for families at the poverty line. Computers or tablets add upfront costs of HK$3,000 to HK$8,000.
Digital literacy compounds access issues. Older residents and recent immigrants may have internet access but lack skills to use online services effectively, creating functional exclusion despite technical connectivity.
Food security and nutritional adequacy
Food insecurity affects approximately 400,000 Hong Kong residents who regularly skip meals, reduce portion sizes, or rely on the cheapest, least nutritious options.
The manifestations vary:
- Families eating rice with soy sauce as complete meals
- Children arriving at school without breakfast
- Elderly residents choosing between medication and food
- Parents feeding children while going hungry themselves
Food prices in Hong Kong rank among the highest globally. A basic nutritious diet costs approximately HK$50 per person daily, totaling HK$6,000 monthly for a family of four. This represents 60% of income for households at the poverty line.
Food assistance programs provide critical support but cannot meet full demand. Food banks report turning away applicants due to supply limitations. School lunch subsidies help but do not cover dinners, weekends, or school holidays.
Nutritional quality suffers most. Fresh vegetables, fruits, and protein sources cost significantly more than instant noodles, white rice, and processed foods. Low-income families consume diets high in refined carbohydrates and sodium but deficient in vitamins, minerals, and protein.
The health consequences appear in higher rates of anemia, stunted growth in children, and diet-related chronic diseases. These health impacts then create additional economic burdens, perpetuating poverty.
Social participation and inclusion
Social exclusion represents perhaps the least visible yet most damaging poverty dimension. Inability to participate in normal social activities isolates individuals and limits opportunities.
Children from low-income families often cannot:
- Join school trips requiring fees
- Participate in sports requiring equipment or uniforms
- Attend classmates’ birthday celebrations with appropriate gifts
- Engage in extracurricular activities that build friendships
This exclusion affects self-esteem, peer relationships, and social skill development. Children internalize shame about their circumstances, affecting mental health and academic motivation.
Adults face similar barriers. Social gatherings often involve expenses for meals, transportation, or activities that low-income individuals cannot afford. Over time, invitations decrease and social networks shrink.
Community participation requires resources. Volunteering opportunities may require transportation costs. Civic engagement meetings occur during work hours. Cultural events charge admission fees.
The psychological impact of social exclusion compounds material deprivation. Isolation increases depression and anxiety rates. Reduced social networks limit access to job information, mutual support, and collective advocacy.
Measuring poverty comprehensively
The seven poverty indicators Hong Kong uses create a multidimensional picture that income alone cannot capture. Researchers and policymakers increasingly recognize that deprivation manifests through interconnected disadvantages.
Someone experiencing three or more of these indicators faces severe multidimensional poverty:
- Housing inadequacy (overcrowding, poor conditions, unaffordable rent)
- Educational barriers (incomplete schooling, lack of learning resources)
- Employment precarity (unstable work, insufficient income, no benefits)
- Health access limitations (delayed care, untreated conditions, poor outcomes)
- Digital exclusion (no internet access, inadequate devices, low literacy)
- Food insecurity (insufficient quantity, poor quality, skipped meals)
- Social isolation (inability to participate, limited networks, exclusion)
Data shows that 42% of income-poor households also experience at least two additional deprivations. This overlap demonstrates how disadvantages cluster and reinforce each other.
The multidimensional approach also identifies vulnerabilities among those above the income poverty line. Approximately 300,000 Hong Kong residents earn sufficient income yet face severe deprivation in housing, health, or social inclusion.
Policy implications and intervention design
Understanding poverty through multiple indicators transforms how interventions get designed and evaluated.
Income transfers alone cannot address housing quality, educational gaps, or social exclusion. Effective poverty reduction requires coordinated approaches:
- Housing policy that prioritizes affordability and adequate living standards
- Educational support that includes tutoring, meals, and extracurricular access
- Employment programs that emphasize job quality and worker protections
- Healthcare expansion that reduces wait times and covers essential services
- Digital inclusion initiatives providing devices, connectivity, and training
- Food security programs ensuring nutritional adequacy, not just calories
- Community development that builds social capital and participation opportunities
Evaluation metrics must track changes across all dimensions. A policy that raises incomes but worsens housing stress or reduces social participation may not improve overall wellbeing.
The interconnected nature of poverty indicators suggests that interventions addressing multiple dimensions simultaneously create synergistic benefits. For example, improved housing quality enhances health outcomes, educational achievement, and employment stability.
Data collection and monitoring challenges
Tracking multidimensional poverty requires robust data systems that many jurisdictions lack. Hong Kong faces several measurement challenges:
- Inconsistent data collection across different government departments
- Privacy concerns limiting data sharing and integration
- Lag times between data collection and policy application
- Difficulty capturing informal or hidden populations
- Subjective elements in measuring social exclusion or wellbeing
The Social Development Index addresses some gaps by compiling indicators from multiple sources. However, comprehensive poverty monitoring requires sustained investment in data infrastructure and interdepartmental coordination.
Longitudinal data proves particularly valuable. Tracking individuals and families over time reveals poverty dynamics: who exits poverty, who falls into it, and what factors drive these transitions. This information guides prevention and intervention timing.
Community-based participatory research complements official statistics. People experiencing poverty provide insights that administrative data cannot capture about daily challenges, coping strategies, and intervention effectiveness.
Moving beyond income-focused solutions
The evidence is clear. Poverty in Hong Kong extends far beyond insufficient income. Housing conditions, educational access, employment quality, health outcomes, digital connectivity, food security, and social inclusion all define whether people can meet basic needs and participate fully in society.
Policymakers, researchers, and practitioners increasingly recognize that effective poverty reduction requires multidimensional strategies. Income support remains important but insufficient without addressing the structural factors that create and perpetuate deprivation.
For academic researchers, these seven indicators provide frameworks for investigating poverty dynamics and evaluating interventions. For policy analysts, they offer metrics for assessing program effectiveness across multiple wellbeing dimensions. For social workers and NGO professionals, they highlight the interconnected challenges clients face and the need for holistic support.
Understanding poverty through multiple lenses does not just improve measurement accuracy. It fundamentally changes how we think about solutions, moving from narrow income transfers toward comprehensive approaches that address root causes and build genuine opportunity for all Hong Kong residents.