


How Many Hong Kong Residents Live in Poverty? Breaking Down the Latest Statistics by District and Demographics
Poverty in Hong Kong remains one of the most pressing social challenges facing the city.…
The Hidden Cost of Living Crisis: Tracking Essential Expenses vs Wage Growth Since 2010
Your salary statement shows bigger numbers than five years ago. Yet groceries feel more expensive.…

Youth Unemployment and Underemployment: Statistical Trends Shaping a Generation
The job market for young people in Hong Kong tells a story that numbers can't…
Does Social Welfare Spending Reduce Poverty? Analyzing Two Decades of Evidence
The relationship between government spending and poverty outcomes has sparked debate for decades. Politicians promise…

What Do 20 Years of GDP Data Reveal About Hong Kong’s Economic Resilience?
Two decades of economic data tell a story that numbers alone cannot capture. Hong Kong…

7 Critical Indicators That Define Poverty in Hong Kong Beyond Income Levels
Measuring poverty by income alone paints an incomplete picture. In Hong Kong, where living costs…
Understanding the Working Poor: Employment Statistics That Challenge Common Assumptions
Millions of people clock in every day, work full shifts, and still struggle to afford…
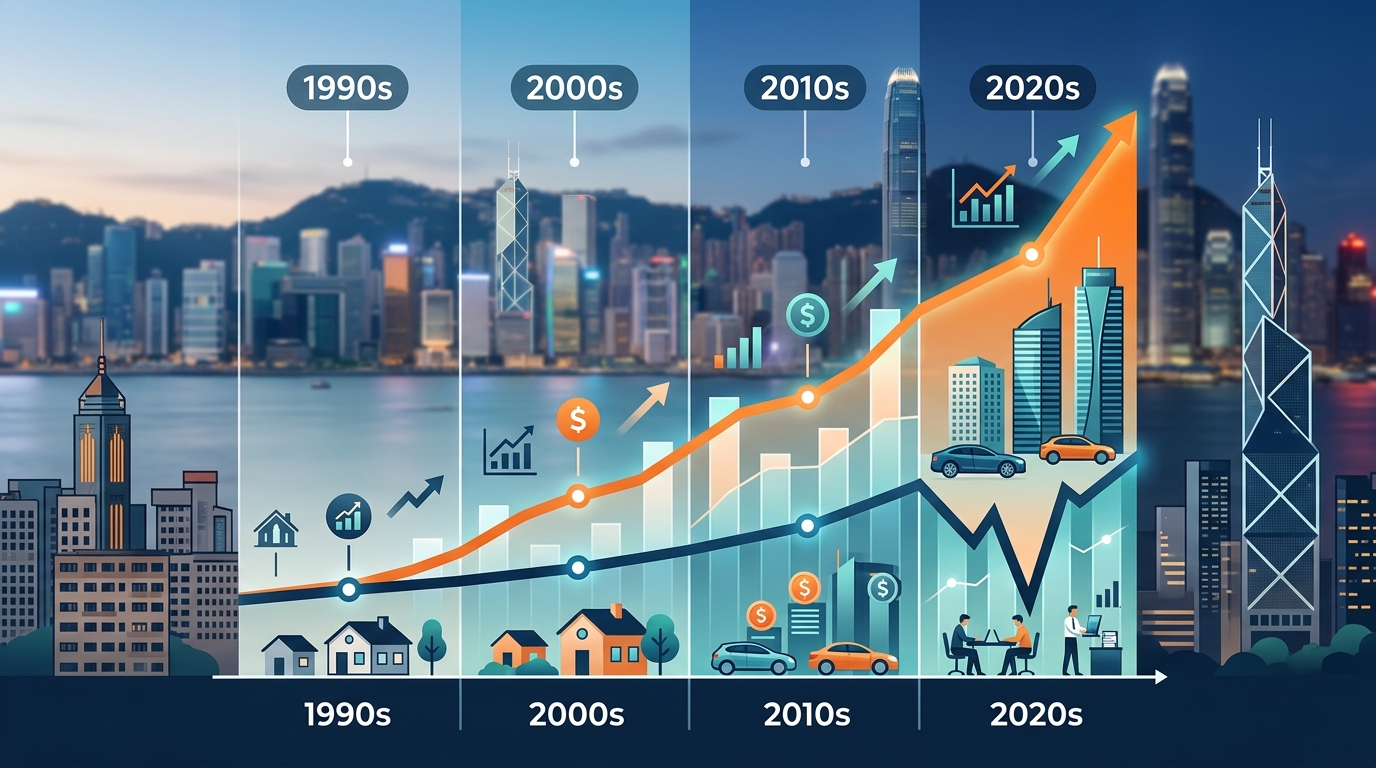
How Income Inequality in Hong Kong Has Evolved Over Three Decades
Hong Kong stands as one of the world's wealthiest cities, yet it also carries one…
7 Critical Indicators That Define Poverty in Hong Kong Beyond Income Levels
Measuring poverty by income alone paints an incomplete picture. In Hong Kong, where living costs…