


From Cage Homes to Nano Flats: Quantifying Hong Kong’s Shrinking Living Spaces
Hong Kong residents squeeze into some of the tiniest homes on the planet. The average…
Mapping Housing Inequality: District-by-District Statistical Breakdown
Housing disparities don't look the same across every neighborhood. In Hong Kong, the gap between…

The Hidden Correlation Between Housing Stress and Social Wellbeing Outcomes
Families across Hong Kong face a stark reality: rising rents and property prices consume larger…
Why Are Elderly Residents Disproportionately Affected by Inadequate Housing?
Older adults should be able to live in safe, comfortable homes. Yet across Hong Kong…

Does Public Housing Still Work? Evaluating Wait Times and Allocation Efficiency
The average wait time for public housing in Hong Kong has stretched beyond five years,…

5 Critical Housing Indicators Every Policy Advocate Should Monitor
Housing advocates need numbers that tell the truth. Not abstract statistics that look impressive in…
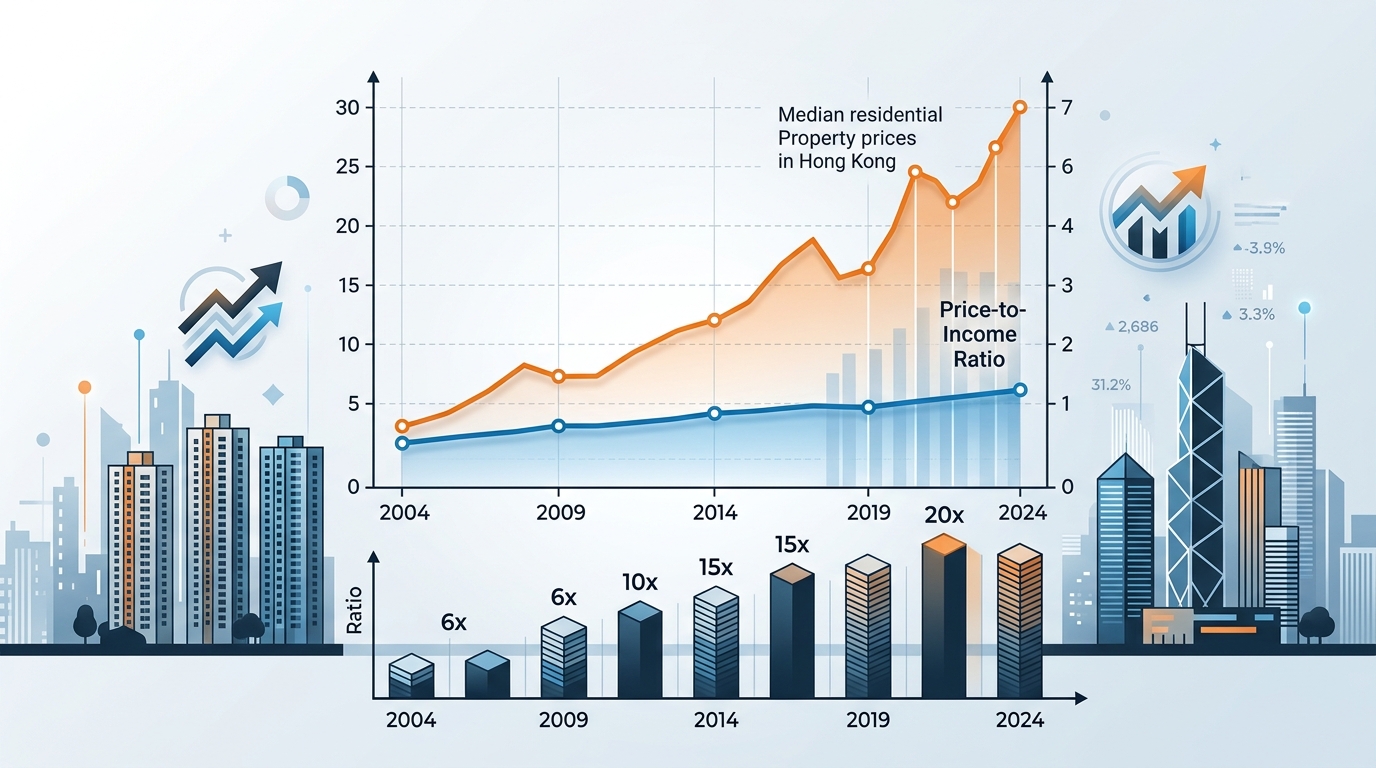
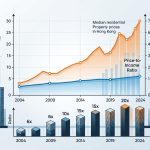
The True Cost of Homeownership: Tracking Property Price-to-Income Ratios Over Two Decades
Housing affordability isn't just about sticker prices. A property listed at HK$8 million might seem…

Special Educational Needs Support: Tracking Resource Allocation and Student Outcomes Over Time
Managing budgets for special education programs means keeping track of dozens of moving parts at…
How Subdivided Flats Are Reshaping Hong Kong’s Urban Landscape
Over 220,000 people in Hong Kong call subdivided flats home. These cramped living spaces, carved…